
Investors across the country pushed the panic button following Friday’s lousy jobs report.
Employers added just 114,000 jobs in July compared to economists forecasting 175,000.
The huge miss sent U.S. markets lower on Friday.
But the klaxons continued to ring into Monday’s opening bell, with Japan’s Nikkei 225 suffering its worst day — a 12% decline — since the Reagan Administration.
Europe joined the party when the Stoxx 600 fell 2.2% at its close Monday.
By Monday’s close, the S&P 500 and Nasdaq Composite were both at least 3% lower, with the Dow Jones Industrial Average not far behind.
The fear is that waning momentum in the U.S. labor market, paired with the Federal Reserve not acting fast enough to lower interest rates, has put the country on a fast path toward a recession.
Now is a great time to curb recession fears and analyze the market with a critical eye, especially after the market recovered at a healthy clip on Tuesday.
Because looking at one piece of data — such as the jobs report — doesn’t necessarily give us a complete picture…
Rules Are Meant to Be Broken
All of this talk about recession is because Friday’s job numbers triggered what is called the “Sahm Rule.”
The rule, created by economist Claudia Sahm, says that when the unemployment rate on a three-month average goes up 0.5 percentage points from the lowest point in the last 12 months, the economy is in the early stages of a recession.
Since January 2024, the unemployment rate has gone up 0.6 percentage points, triggering the rule.
Under normal circumstances, I can see the reason for some panic.
But, as anyone who has even watched the stock market in the last four years knows, these are not normal circumstances. The impact of the COVID-19 pandemic in 2020 — i.e., high unemployment and a stock market bottom — has rendered a lot of traditional economic rules pointless.
Has the job market cooled? Yes.
Is it to the point where full-blown panic is in order? Take a look at this chart from Bloomberg and Edward Jones…
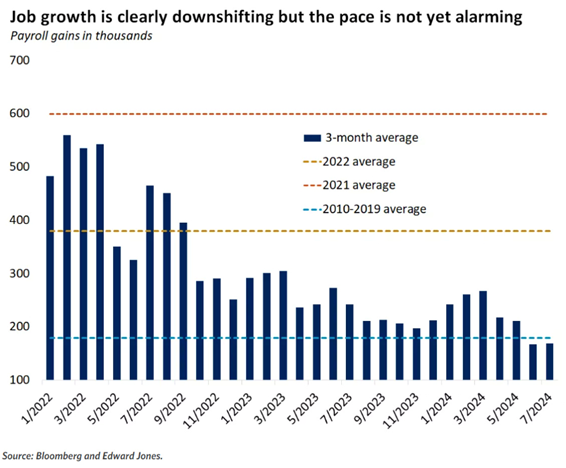
This chart shows the payroll gains using a three-month moving average. It also shows the averages for 2022, 2021 and 2010-2019.
Comparing 2010-2019 is important here because it is before the pandemic set in … or under more normal circumstances. We should be comparing today with this, not 2021 or 2022, because of the huge reversal in job growth following the pandemic.
I see comparing now to before the pandemic as more apples to apples.
Yes, job growth has slowed after a hot start to the year. But even with July’s dismal numbers, the three-month average is only slightly below the monthly average from 2010-2019.
For the record, Sahm even told Yahoo! Finance that the recent jobs report was concerning, but “it’s not a crisis.”
And weaker jobs weren’t the only factor in the recent sell-off.
The Power of the Carry
Let’s look at Japan.
Hedge funds often go to countries like Japan and Switzerland to help fund domestic investments.
That’s because the cost of borrowing money in those countries has been next to zero. Use that money to buy a high-yield investment, pay back what you borrowed, and keep what’s left.
In investment terms, it’s called a carry trade. And it’s a highly profitable strategy … until it isn’t.
Over the weekend, the Bank of Japan — the Japanese equivalent of the Federal Reserve — decided to increase its fund rate, making Japanese currency not so cheap to borrow. As a result, the yen rallied 11% against the dollar, and those hedge funds that used Japanese currency were caught on the wrong side of trades.
That forced them to unwind those trades in a hurry — meaning they had to sell those tech stock positions in the U.S. quickly to avoid huge losses.
And speaking of tech…
You Jump In With Both Feet; You Learn to Tread Water
A lot of big investors (and even small ones) have reached what I would call an Icarus moment, where they have flown a little too close to the sun.
They’ve been making massive plays into any stock that’s related to artificial intelligence (AI) and tech. That caused a significant rise in those AI-related stocks:
From its 2024 low in January through the first week of March, the GlobalX Robotics and Artificial Intelligence Index (Nasdaq: BOTZ) jumped 23%.
Since March, the index has been hovering slightly below that high.
More bullish trading sent sky-high valuations for tech stocks even higher.
These valuations made large investors a little twitchy. They were looking for any reason to take their gains and pivot to stocks more likely to see gains after the Fed cuts interest rates. Hence, we saw small-cap stocks make a strong run leading up to July’s Fed meeting — the Russell 2000 jumped 12% from the end of June 2024 to the end of July 2024.
The Bottom Line: What I see here is a stock market that wants the Fed to move faster on rate cuts than the Fed actually wants to.
Last week, central bank officials held its fed funds rate steady and softened its language on its two mandates: employment and inflation.
The Fed’s mandate doesn’t say anything about the stock market.
Just as Adam and I have said, one data point doesn’t suggest a rate cut, and one data point doesn’t suggest a recession either.
These recent market moves are much bigger than a single jobs report, as you can see with other factors like unwinding carry trades and overinvestment in tech.
Does that mean it will be smooth sailing from here? No.
But it does suggest we are pushing that panic button a little too quickly.
Until next time…
Safe trading,

Matt Clark, CMSA®
Chief Research Analyst, Money & Markets