“Inverted yield curve” are three words investors fear most and just this week, short-dated yields pushed above the long-dated yields, a major recession warning signal for Wall Street that could send stocks plummeting in 2019.
Per MarketWatch:
“History suggests that once the Treasury yield curve becomes very flat or starts to invert, the stock market tends to struggle over the following couple of years, as the economy eventually starts to weaken,” said Oliver Jones, an analyst for Capital Economics.
The widely-watched gap between the 10-year note TMUBMUSD10Y, +0.00% and the 2-year note TMUBMUSD02Y, +0.00% narrowed to 11 basis points, according to Tradeweb data. And less common pairings used to assess the curve’s slope such as the spread between the 3-year TMUBMUSD03Y, +0.00% and the 5-year TMUBMUSD05Y, +0.00% , along with the 2-yearTMUBMUSD02Y, +0.00% and the 5-year inverted on Monday.
And the curves flattening sent shivers through the market on Tuesday as stocks cratered.
The S&P 500 index slid 90 points, or 3.2 percent, to 2,700. The Dow plunged 799 points, or 3.1 percent, to 25,027, more than erasing its 488-point gain over the previous two trading days, and the Nasdaq composite lost 283 points, or 3.8 percent, to 7,158.
When short-term yields exceed their long-term counterparts, inverting the curve, a recession has usually followed. In the last nine times when the spread between the 2-year and the 10-year turned negative, economic growth has ground to a halt.
Admittedly, the timing between an inversion and a recession can vary from six months to as much as two years. That means stock-market investors may be tempted to stick through the recent market volatility and try to reap the benefits of robust growth, as the world’s largest economy is still expected to expand at a healthy 2.5% clip in 2019, according to economists polled by MarketWatch.
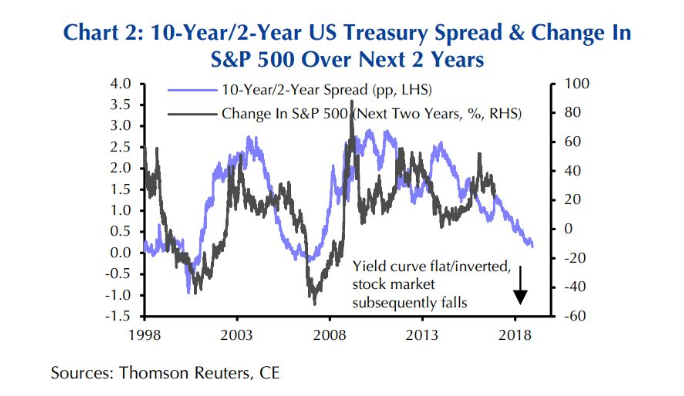
Yet Jones says investors may not want to take any chances. In the chart below, he shows that whenever the spread between the 2-year note has matched or pushed above the 10-year note yield, the S&P 500’s returns over the next two years has turned negative. He expects the S&P 500 to slump 15% in 2019.
The yield curve’s predictive abilities as a recession indicator has troubled investors who see the strong economic tailwinds that had propped up the U.S. economy in 2018 fading. Uncertainty from tariffs have helped undercut corporations’ incentives to invest in their own businesses. While, the stimulus from the tax cuts passed in early 2017 may no longer serve as a powerful boost to growth in the coming years.
Jones admits that short-dated yields remain lofty thanks to a Federal Reserve that still holds the economy’s prospects in high regard, enabling it to raise key rates without fear of undercutting growth. New York Fed President John Williams said Tuesday that the strong outlook for the U.S. economy meant the central bank would continue to raise rates in a gradual fashion.
The 2-year note ended at 2.811%, down from its multidecade high of 2.969% reached on Nov. 8. But the short-dated maturity traded well above where it started at the year, which was 1.891%.
The 5-year yield closed Tuesday at 2.797%, and the 10-year yield ended at 2.911%, according to Dow Jones Market Data.
“The fact that the yields of the shortest-dated bonds have held up presumably reflects the fact that the U.S. economy is in good health for now, and that the Fed has signalled fairly clearly that at least another couple of rate hikes are likely,” said Jones.
But the pullback in core inflation and crude-oil prices raise questions about “how long growth in the U.S. can remain so strong,” he said.