Many traders use seasonal stock analysis because some patterns repeat every year.
Companies announce earnings at the same time each quarter…
Trade shows and research conferences occur at the same time every year…
Even corporate events are pretty reliable occurrences on the calendar.
While many traders rely on this data for stocks, these patterns were first identified in commodities. Some commodities cycles are easier to follow. Corn is planted in the spring in the U.S. and harvested in the fall, creating seasonal price trends.
But there’s another seasonal commodity trend that’s less obvious.
Myth Busted
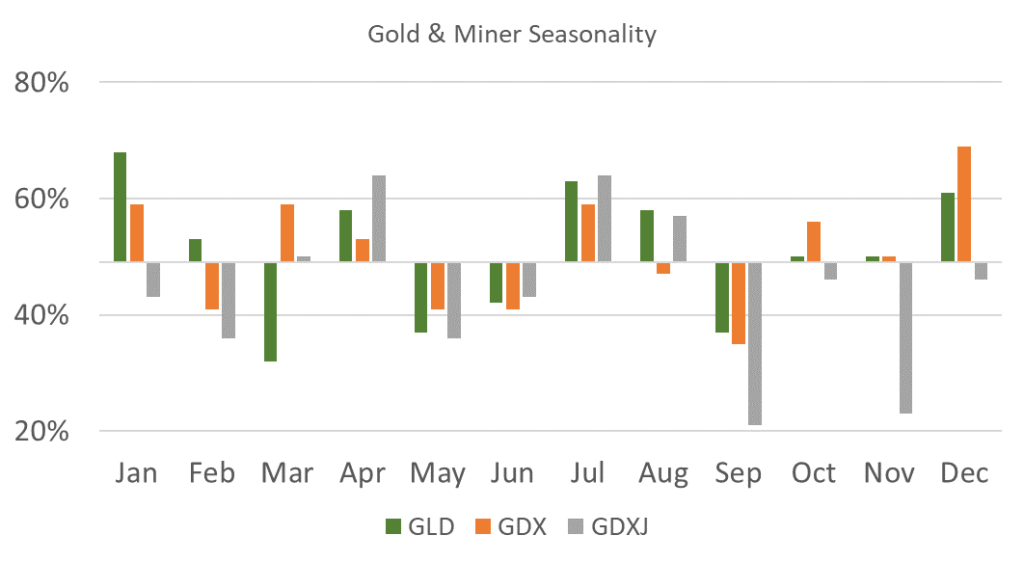
The chart below shows how often three gold and gold miner exchange-traded funds (ETFs) closed higher for a month since their inception. The three funds I looked at are the SPDR Gold Shares (NYSE: GLD), the VanEck Gold Miners ETF (NYSE: GDX) and the VanEck Junior Gold Miners ETF (NYSE: GDXJ).
One reason I chose those three ETFs is to bust a myth about gold investing. Many investors believe gold miners offer leveraged exposure to gold prices. The logic is sound at first glance.
Let’s assume it costs a miner about $1,000 an ounce to produce gold and they mine 1 million ounces per year. If gold is at $1,900 an ounce, the company should generate a profit of about $900 an ounce, or $900 million.
In this simplified example, we’ll assume the company has no other costs and no additional revenue. If the price of gold increases by 30%, to $2,740 an ounce, assuming the costs of production stay the same, the miner’s profits would increase to $1,740 an ounce or $1.74 billion, That’s an increase of 93%!
In this example, the miner is leveraged almost 2-to-1. Even smaller gains in the price of gold have a large impact on earnings. A 1% increase in gold prices (to about $1,920 an ounce) results in a 2% jump in the earnings of this hypothetical mining company.
Of course, while leverage can increase investment returns on the upside, it results in large losses on the downside.
A 1% decline in the price of gold could result in a 2% drop in earnings for this gold miner. That creates selling pressure in the stock.
Given this leverage, it might seem best to buy the miners, especially when seasonals are bullish.
But after running the test, I came to a different conclusion…
For both GLD and GDX, the best three months start on October 1. GLD delivered a 5.7% average gain 61% of the time in the last quarter of the year. GDX investors won only 47% of the time for those three months. The average gain there is 6%.
Over the long run, investors make more money owning GLD for those three months, even though the average gain is smaller. It all comes down to the other side of the trade. The largest loss for GLD has been just 6%, while the largest loss in GDX was 19.9%.
Before getting to a specific trading strategy, I want to mention the other ETF in the test. GDXJ, the junior miner ETF, is a consistent loser. As a group, junior miners fail more often than they win. There are some massive gains in this space, but selectivity is the key. This is one of those times when picking individual stocks instead of an ETF can pay off.
1 Trade for Gold’s Seasonal Trend
With that in mind, let’s explore a potential trade in GLD for the fourth quarter.
I’ll be frank, I don’t like owning GLD. There are some tax consequences associated with that ETF I prefer to avoid. You should consult your tax professional to see if that investment is right for you.
Rather than buying shares of the GLD fund, I trade options on it instead. I buy call options to benefit from the expected rally.
The December 29, 2023, $178 call is trading at $6. That’s about 3.3% of the price of GLD. Compared to 100 shares of the ETF, this amounts to about half of the largest loss in my test period. That manages the risk of the trade.
This option could be sold at a profit(or loss) at any time before the end of the year. You can also hold it until the end of December to profit if gold follows its typical seasonal pattern.
Until next time,

Mike Carr
Senior Technical Analyst