

In today’s Marijuana Market Update, I:
- Break down 1933 Industries Inc. (OTC: TGIFF), a cannabis company emailed to me by a viewer.
- Provide an update on the brand-new Money & Markets Cannabis Index.
First, I’ll look at TGIFF.
1933 Industries Inc. Breakdown
Recently, Ross sent in an email, saying:
Good afternoon Matt,
I’ve been an active listener and enjoy your unbiased analysis when evaluating companies. I am interested to know your thoughts on 1933 Industries Inc. The company is also listed on the Toronto Stock Exchange. Looking forward to hearing your thoughts and analysis on this company. — Ross
Thank you, Ross, for your email.
1933 Industries Inc. is a Vancouver-based cannabis company that produces several medical and recreational items:
- Lotions.
- Creams.
- Cartridges.
- THC concentrates and much more.
Its labels include: Canna Hemp, Canna Hemp X, Canna Hemp PLUS and Canna Hemp HEMP.
The company started as Friday Night Inc. and changed its name to 1933 Industries Inc. in 2018.
1933 Industries Financials
Let’s look at the financial picture for this company first.
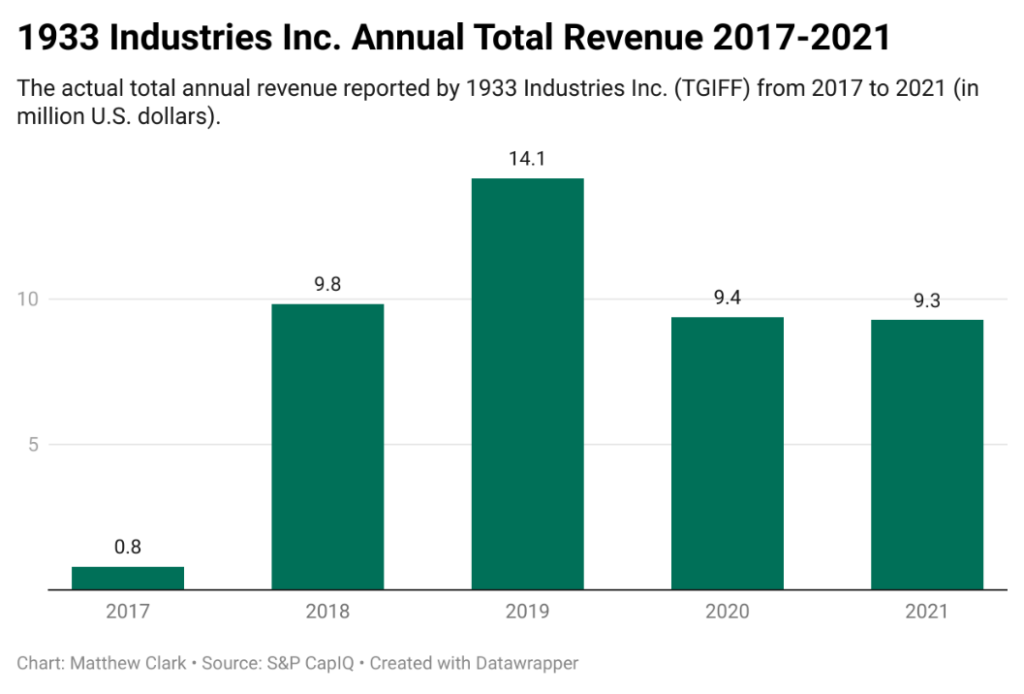
You can see in the chart above that from 2017 to 2019, 1933 Industries’ run was impressive. Total revenue jumped from around $1 million to $14.1 — a 1,310% increase.
However, the COVID-19 pandemic didn’t produce the kind of revenue growth for 1933 that it did for other cannabis companies.
Its top-line revenue fell to $9.4 million and shaved a bit more off in its 2021 fiscal year — down to $9.3 million — a 34% drop from its 2019 high.
1933 Industries has struggled to generate a profit.
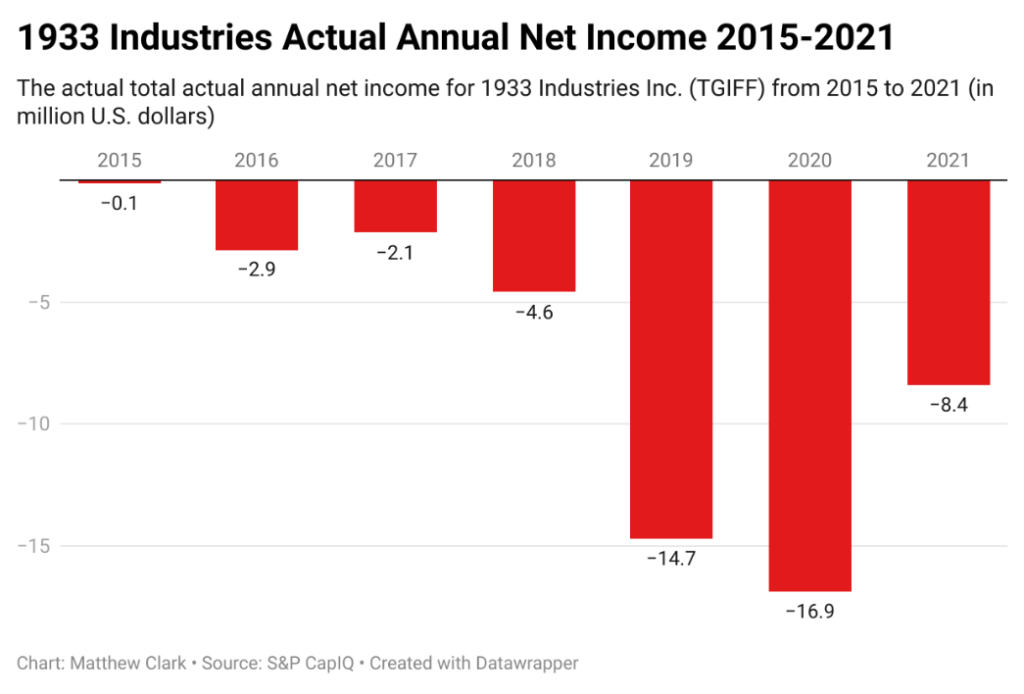
In the chart above, you can see that the company has hemorrhaged cash since 2015.
In 2020, 1933 Industries suffered its biggest loss — reporting an annual net income loss of $16.9 million — meaning it spent nearly twice what it brought in for revenue that year.
In its recent quarterly report in June, the company reported a paltry positive net income of around $600,000, or $0.002 per share in earnings.
Consider that, in 2020, 1933 Industries reported earnings of minus-$15.68 per share, a massive shortfall.
1933 Industries Stock Performance
Its stock hasn’t fared much better of late:
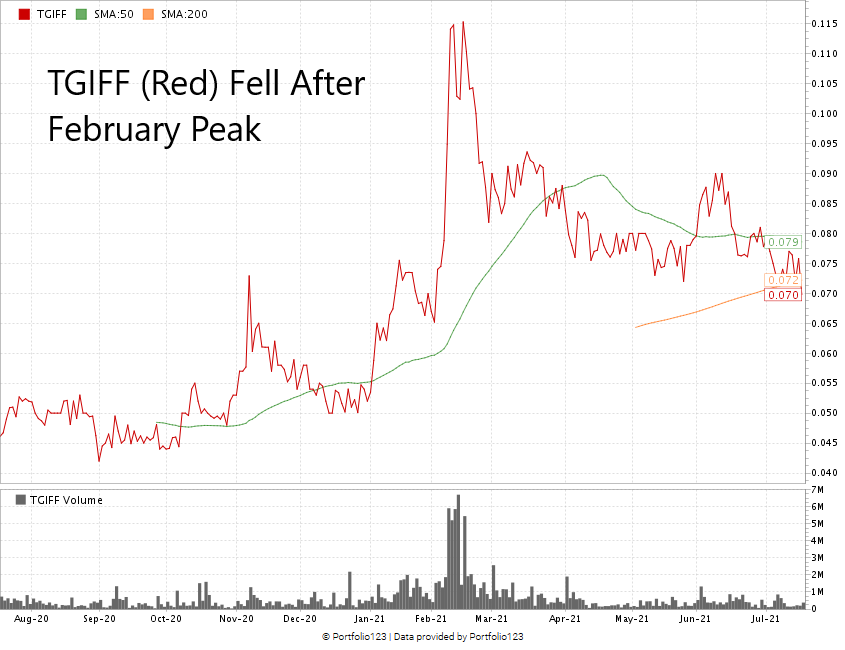
You can see the stock price’s decent run-up in late February in the chart above. (This was the case for most other cannabis stocks.) However, TGIFF’s drop was steep.
After reaching a high of $0.12 per share on February 16, the share price started to fall. Nine days after reaching its high, TGIFF was down to $0.08.
TGIFF now trades at $0.07 per share — a 41% drop from its February high.
It crossed below its 200-day moving average (the orange line in the chart above) — constituting a “death cross” — which could signal further downside to the stock.
The company just received an adult-use distribution license in Nevada. It hopes its debtholders will allow the company to extend the maturity of some of its debt — giving 1933 Industries more time to pay it off.
Bottom Line for TGIFF
All told, I see a lot more downside to this stock than up.
The company is small, but it needs to clear up its many financial issues before I would want to buy in.
TGIFF’s share price seems “cheap,” but that doesn’t mean it’s a buy.
It’s best to stay on the sidelines on this.
Introducing the Money & Markets Cannabis Index
The second item I want to discuss is our new Cannabis Index. I rolled this out last week as a way to track the broader cannabis market.
The index tracks cannabis companies with market caps over $10 million.
For the last several weeks, I’ve worked to develop the Money & Markets Cannabis Index.
According to my latest scan, 223 companies meet the criteria of market capitalization and listing on either a major U.S. exchange or over the counter.
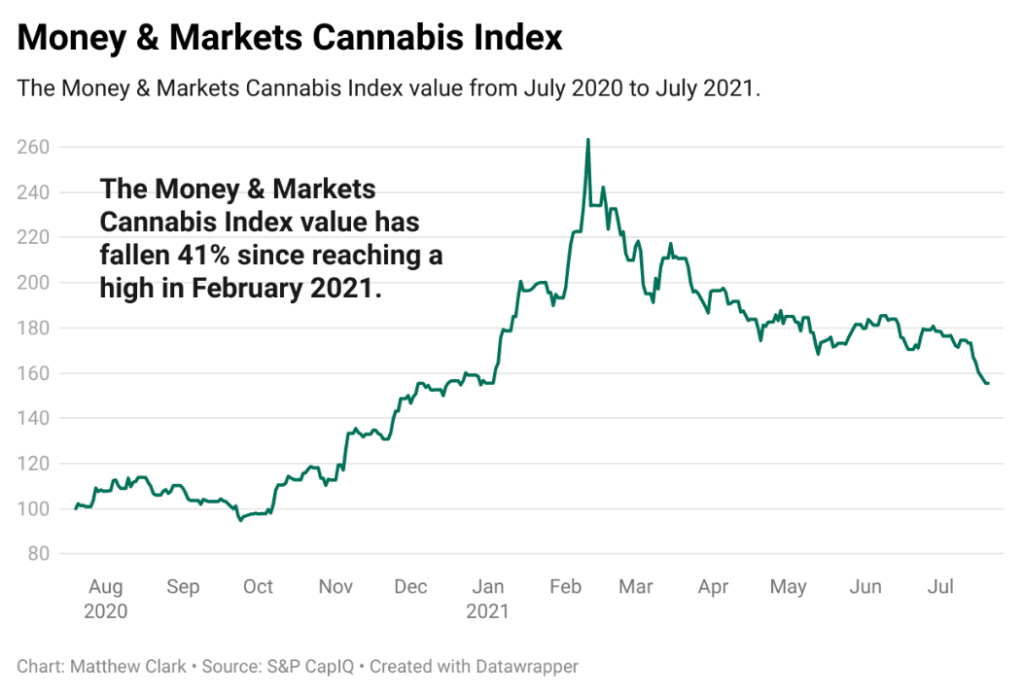
As you can see, the index reached a high point in mid-February when cannabis stocks were more popular with investors as states passed legalization measures and talk of federal legalization was at a high point.
After a 69% run-up from July 2020 to February 2021, the index value has fallen 41% — indicating a drop in the broader cannabis market.
This index gives you, a cannabis investor, a different look at how the broader cannabis market is performing from one day to the next.
I will update this index and let you know its performance every week.
New YouTube “Join” Feature

We offer members new exclusive content, including:
- Interviews with cannabis insiders.
- Blog posts, stock analysis and company breakdowns.
- More about our Cannabis Watchlist.
- Monthly live chats with me, where we’ll discuss cannabis stocks, the cannabis sector and much more.
Just click “Join” on our YouTube page to find out what you can access.
If you have a cannabis stock you’d like me to look at, email me at feedback@moneyandmarkets.com.
Where to Find Us
Coming up this week, we’ll have more on The Bull & The Bear podcast, so stay tuned.

I also appear in the revamped Investing With Charles video segment, where Charles gives his take on on everything from the hottest market topics to the global economic landscape.
Also, you can follow me on Twitter (@InvestWithMattC), where I’ll give you even more insights, not just in the cannabis market.
Remember, you can email my team and me at feedback@moneyandmarkets.com — or leave a comment on YouTube. We love to hear from you!
Safe trading,

Matt Clark, CMSA®
Research Analyst, Money & Markets
Matt Clark is the research analyst for Money & Markets. He is a certified Capital Markets & Securities Analyst with the Corporate Finance Institute and a contributor to Seeking Alpha. Prior to joining Money & Markets, he was a journalist and editor for 25 years, covering college sports, business and politics.