
If you’re making buy decisions based on the daily gyrations of the S&P 500, you’re setting yourself up for big losses — and costing yourself a shot at big dividends, too.
Why? For starters, at a 2% average yield, the popular names simply don’t pay enough. You’d need to save $2 million just to generate $40,000 in yearly dividends. And let’s be honest: If you have that much cash, you may as well just live on your $2 mil — and forget about dividends entirely!
The rest of us need a better option — one that lets us save a reasonable amount of money (I’m talking $500,000 to $600,000 here) and still generate meaningful income. I’ll give you my two best strategies for doing that in a moment. First, let me show you why the market’s so-called rebound from its March 23 low is a mirage.
Mr. Market’s Masquerade Ball
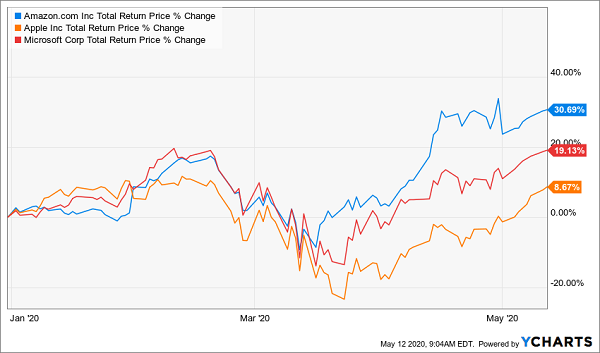
One thing everyone forgets about the S&P 500 is that the index is weighted by market cap. That gives favor to Microsoft (MSFT), Apple (AAPL) and Amazon.com (AMZN), its top three holdings, which have outperformed by a wide margin lately.
Big Tech: Crisis? What Crisis?
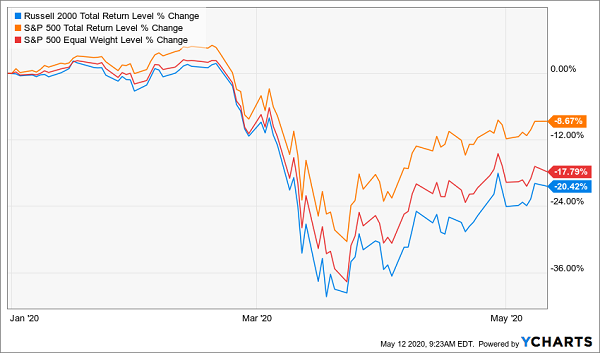
Obviously, most investors, income fans included, own a wider basket of stocks. And the wider the basket, the rougher the year it’s been. Let’s consider that (as I’m writing this):
- Year to date, the “big cap focused” S&P 500 is down “just” 9%. However,
- When we weight its 500 stocks equally, its return drops to -18%. And,
- When we expand the universe to small caps, we see the Russell 2000 is down a brutal 20%:
The Real Story
This is why I’m advising my Contrarian Income Report members to fight the fear of missing out. We’ve got plenty of time to deploy our capital: Unemployment is likely above 20%, and those of us lucky enough to be working are still stuck at home.
That makes now the time to comb through the wreckage, build our shopping list and make strategic buys of stocks and closed-end funds (CEFs) with unusually high dividend yields, unusually big discounts and business models that will set them up for growth after the pandemic subsides.
But how do we know when it’s time to move a stock from our watch list to our buy list? Let’s move on to my two favorite contrarian methods for doing just that.
Contrarian Strategy No. 1: Watch the “Shorts” — and Do the Opposite
Short selling has been around almost as long as stocks, with the first short sellers betting against the Dutch East India Company back in 1609. But unlike those pioneers of pessimism (who made a fortune, by the way), today’s short sellers are often wrong — especially at the extremes.
(If you’re unfamiliar, short selling involves selling a stock you’ve borrowed, with a commitment to buy it back later, hopefully at a lower price. Your profit lies in the difference between the selling price and the price at which you have to buy it back.)
Before you ask, no, we’re not going to “short” stocks ourselves. Instead, we’re going to tap the short sellers’ greed for big upside and growing dividend payouts, too.
Here’s how: If a stock attracts a lot of short interest and the price moves up, the “shorts” will scramble to buy and “cover” their positions. That’s great for us because it can create a feedback loop where the rising price triggers short covering, driving the price higher, triggering more short covering, and so on.
So an unusually high level of short interest is one indicator to key in on — and it’s even more potent if you combine it with a rising dividend.
To see what I mean, consider W.P. Carey (WPC), an industrial landlord I recommended in the January 2019 issue of Contrarian Income Report. By the time we sold a year later, we’d bagged a market-clobbering 27.7% total return!
We had short sellers to thank. When I saw short interest in the stock rising in late 2018, I took note. After all, WPC paid a generous 6.3% dividend, had raised its payout for 21 straight years and had locked in its tenants with long leases — 10.5 years, on average.
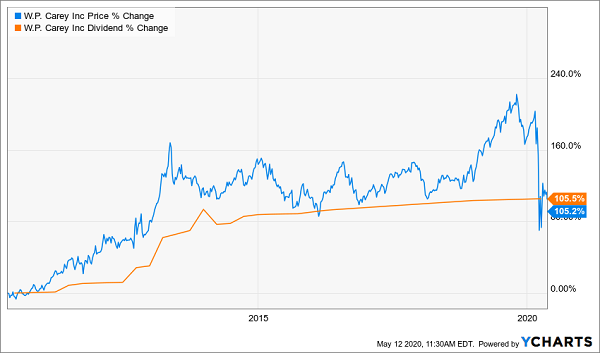
Management was so cash-rich they hiked the payout every single quarter. Those payout hikes acted like a magnet on the share price, with the dividend pulling the stock higher with each increase. This “dividend magnet” has been running full tilt for a decade now:
WPC: Dividend Up 105%, Share Price Up 105%
In other words, the short selling on WPC’s stock had gotten way out of hand, so in January 2019, we pounced. Here’s what happened next:
Shorts Give Up, We Buy In
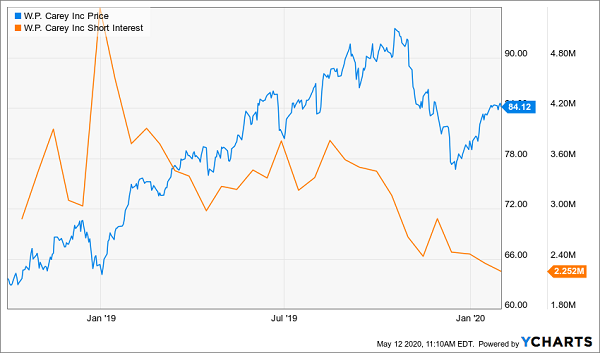
As you can see, rising short interest kept a lid on WPC’s price through late 2018, until the shorts started to throw in the towel — the precise point we bought in. Then we simply collected our gains (and dividends) as short covering and the rising dividend drove the stock price higher.
The takeaway: If you’ve found a stock with a rising payout and rising short interest, it’s definitely worth taking a closer look.
Contrarian Strategy No. 2: Get the Right Price for CEFs
If you read my columns on Contrarian Outlook, you know I’m a big fan of CEFs, as they pay dividends that crush any payout you’ll find on the S&P 500. Right now, there are about 500 CEFs out there, yielding around 7% on average.
One thing to remember about CEFs is that, with few exceptions, they can’t issue new shares to new investors after their IPOs. That’s another way of saying their units, which trade on the open market, can trade at wildly different levels than the per-share value of their portfolios (known in CEF-land as net asset value, or NAV).
And for the record, yes, we always demand a discount!
The difference between NAV and market price is key because a CEF’s NAV is the real barometer of management’s performance, while its price bounces around based on Mr. Market’s mood on any given day. And while market prices are easy to find, NAVs are more nuanced and require a visit to Morningstar.com, YCharts.com or, best of all, the CEF’s direct website.
I’m sure you’re getting what I’m saying here: Focusing on price alone can lead you to do the opposite of what you should with a CEF.
Consider another Contrarian Income Report holding, the Aberdeen Asia-Pacific Income Fund (FAX). As you can see below, FAX’s market-price return (including dividends) crashed in this latest selloff, dropping 34% from its February 19 peak to its March 18 bottom:
FAX’s Market Price Makes It Look Like a Disaster …
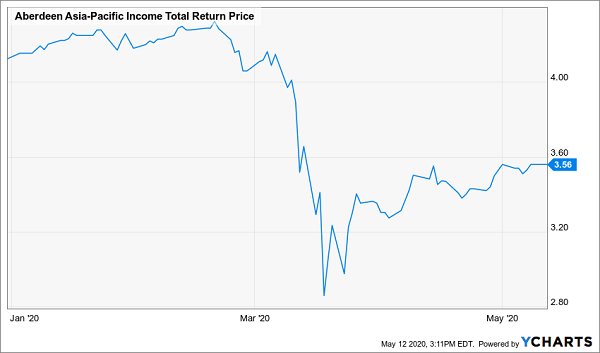
A drop like that might prompt you to avoid FAX, thinking it’s a volatile basket case.
But remember that you’re looking at the fund’s market price here — and all the emotion involved with it. If you look at FAX’s NAV (the orange line below), you’ll see that its portfolio’s performance is much steadier: It didn’t fall nearly as far as the market price and has already started to smoothly track back up:
… But NAV Tells the True Story
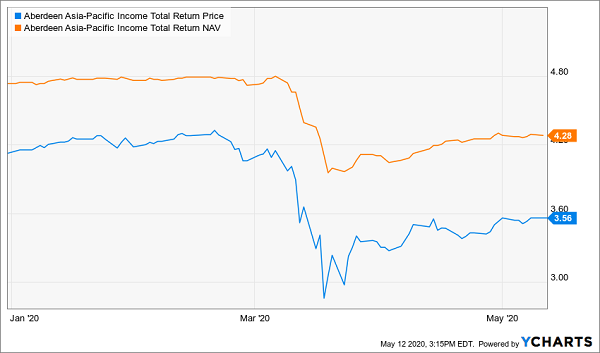
That flips the script! Now we can clearly see that the March plunge was a buying opportunity — a rare shot at grabbing FAX’s portfolio of steady international bonds for 30% off. A deal like that is totally unheard-of with CEFs, where quality funds like FAX almost never sell for more than a 20% discount.
And you’d already be reaping the rewards of that discount: FAX’s market price has rebounded 22.3% in less than two months, from its March low to today, as it races to close that wide discount (FAX trades at a 16.8% markdown now).
Best of all, you’d have already have picked up your first dividend payout (current yield: 9.2%) from this steady monthly payer, too!
The takeaway: If you want a true sense of CEF performance (and whether you’re really getting a deal), you need to look at the NAV—and the margin between it and the market price—to get the real story.
These two strategies are particularly potent if you’re worried about another pullback, because they reveal safe, steady dividend payers that are ridiculously cheap right now.
Those bargain valuations will hedge their downside if stocks do drop from here — and enhance our gains if the market moves higher.
But it’s also true that these two seemingly simple moves aren’t always easy to apply: as I said above, a CEF’s NAV requires a bit of extra digging to uncover — and the same is true of short interest.
To learn more about generating monthly dividends as high as 8%, click here.