The ballooning national debt topped $22 trillion this week, a massive, scary number that doesn’t mean much at the moment, but it could spell disaster for the future of the U.S. economy.
The country’s collective IOU has been growing steadily for decades but exploded following the Great Recession as the Fed began pumping new money in the economy, known as quantitative easing, to try and spur growth as the economy was collapsing.
The national debt under President Barack Obama grew in just eight years nearly as much as it did in the entire 232-year history of the country before he took office.
The debt stood at $10.6 trillion when his terms started, and it was $19.9 trillion when he left, an average increase of $1.16 trillion each year.
The rising debt has continued under President Donald Trump to the tune of $2.06 trillion, or about $991 billion each year he’s been at the helm.
However, there are two more relevant metrics when thinking about the national debt.
One is the percentage of debt compared to GDP, and it’s important because it measures the ability of the government to pay its debt through growth, and it helps measure what you get for your money in terms of how much growth the debt has helped generate.
Per CNBC:
Total debt compared to the economy remained pretty low for decades until it began to climb in the early 1980s while President Ronald Reagan fought the Cold War against the former Soviet Union.
Debt to GDP was about 30.6 percent when Reagan took office in 1981, then steadily climbed to a peak of 65.3 percent in mid-1995, according to data from the St. Louis Federal Reserve. Then-President Bill Clinton and the Republican-controlled Congress eventually carved out a short-lived government surplus, resulting in less of a need to borrow and the level to fall to 30.9 percent in the second quarter of 2001.
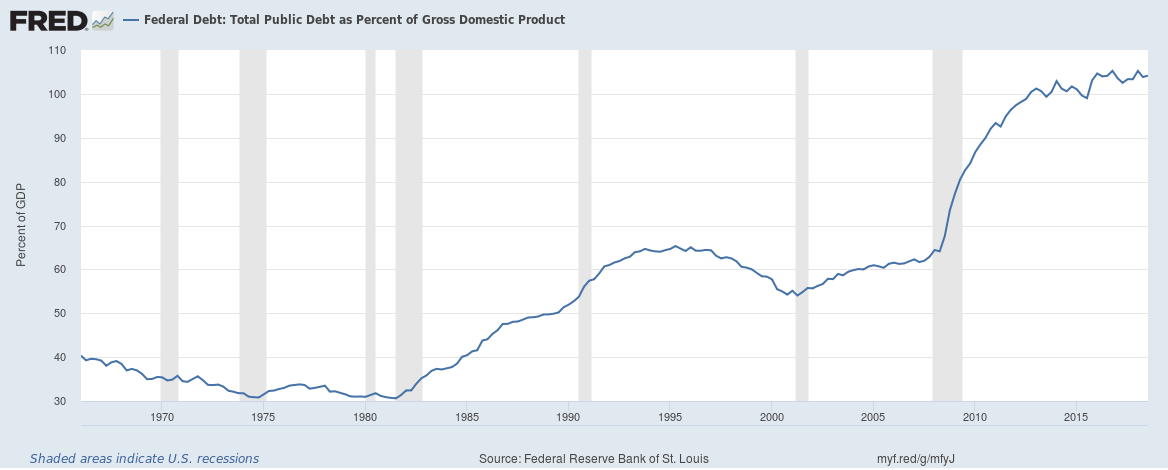
From there, borrowing to finance two wars along with two recessions sent debt to GDP to 77.3 percent by the time Obama took office. When Obama left, the level had risen to 103.6 percent.
Under Trump, there’s been only a small uptick in that regard, with the level standing now at 104.1 percent.
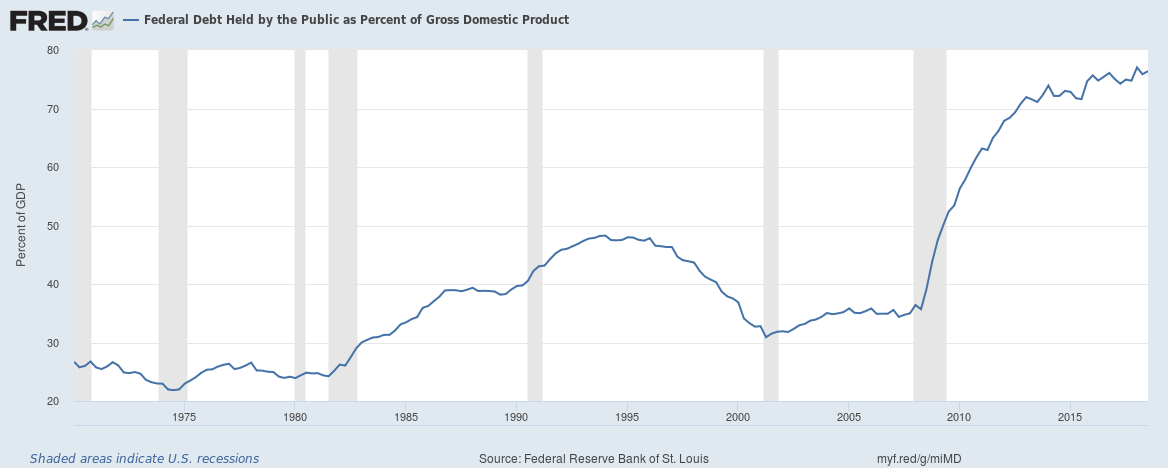
The other relevant metric is debt held by the public, which parses out “intragovernmental holdings,” or money the government borrows to operate from its various trust funds like Social Security and Medicare.
That figure, too, began to rise in the early 1980s, from less than $1 trillion to its current $16.2 trillion. In the Obama years alone, it surged from $6.3 trillion to $14.4 trillion.
In debt-to-GDP terms, the public debt rose from 75 percent when Trump took office to 76.4 percent as of the third quarter of 2018. As a contrast, that level rose from 47.5 percent at the start of Obama’s term to 75 percent when he left.
The future, though, is what has many economists concerned.
The most recent projections from the Congressional Budget Office indicate that debt held by the public will rise to 93 percent of GDP in the next 10 years, or the highest since just after the end of World War II. From there, the level is expected to hit 150 percent by 2049, which is well above what economists consider a sustainable level.
Moreover, should current tax policies stay in place, rather than sunset as they are designed to do, the debt burden will get even worse.
The main culprit of public debt is budget deficits, which have surged under Trump though the CBO now expects the shortfall to be a cumulative $1.2 trillion less than previous projections. The CBO estimates that annual deficits will start topping $1 trillion in 2022, from an estimated $900 billion in fiscal year 2019.
The Trump administration has said economic growth will pay for the added debt and deficit burden, but so far that hasn’t been the case despite the fastest GDP gains of the recovery.