
New traders poured into the stock market after prices bottomed in March. Their timing was good — major stock market averages soared.
But markets go down as well as up.
With the latest S&P 500 decline, new traders are now facing their first market correction. Some may sell in a panic.
Major brokerage firms recognize this risk. Interactive Brokers, a firm popular with day traders, raised its margin requirements this week to protect itself.
Like all brokers, the firm allows investors to borrow money against their stock holdings. With a margin account, for every $1,000 a trader has in their account, they can borrow $1,000 to buy stocks.
Now, instead of putting up an initial deposit of 50%, investors need to put up at least 67.5% of the money they want to invest. This reduces the amount of money risked in the stock market. And that’s bearish news.
Less buying power adds to the selling pressure in the market. That could accelerate a downtrend as traders are forced to sell positions to meet the new requirements.
In this environment, considering the downside risk in the market is reasonable. The chart below shows that the S&P 500 could easily fall to 3,000 points. That is more than 7% below the current level.
S&P 500 Decline: Index Could Fall to 3,000
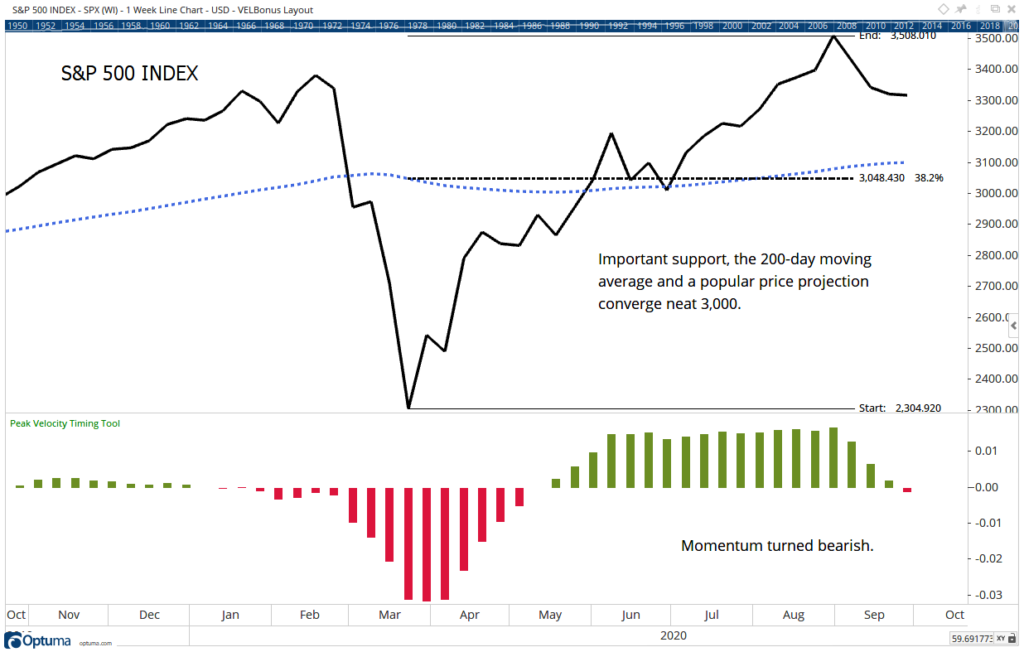
Source: Optuma
3 Bearish Signals of S&P 500 Decline
Three different price targets converge near 3,000.
The blue dashed line is the 200-day moving average (MA). This MA is widely followed and it tends to act as a magnet for prices. The index is likely to fall until it reaches this MA.
The black dashed line is a Fibonacci retracement level of the move from the March low to the high reached earlier this month. Fibonacci levels are important, only because many traders watch them.
Large fund managers may simply wait for a decline to about 3,000 before they add to their positions.
Finally, the low in June was 3,024. Technical analysts call this the support level. Buyers are expected to come back into the market at support levels.
Adding to the risks, the momentum indicator at the bottom of the chart is bearish. This indicator identifies significant reversals. Signals typically remain in place for several months.
The weight of the evidence is bearish. And the initial target for the decline is well below the current price. Of course, prices could drop below the target. Traders should be defensive for at least the next few weeks.
Michael Carr is a Chartered Market Technician for Banyan Hill Publishing and the Editor of One Trade, Peak Velocity Trader and Precision Profits. He teaches technical analysis and quantitative technical analysis at New York Institute of Finance. Mr. Carr is also the former editor of the CMT Association newsletter, Technically Speaking.
Follow him on Twitter @MichaelCarrGuru.