
Just as they do today, traders thousands of years ago saw the value of seasonal tendencies.
For example, grain markets always depended on the seasons.
Seasonal trends also dictated shipping schedules. Ships sailed at the safest times of the year. Insurance markets developed around shipping hundreds of years ago. This led to seasonal trends in some financial markets.
A well-known seasonal trend in financial markets is that stocks tend to crash in the autumn months.
Many of us remember the October crashes in 1987 and 1989. There was also the crash of 1929, which led to the Great Depression. Other fall crashes include the panics of 1857, 1869 and 1907.
Now we understand that panics in the 1800s were tied to seasonal trends. And there’s a reason for that…
Seasonals and Markets — Then and Now
Before the Federal Reserve managed the money supply, money physically moved between banks. Every autumn, money moved west to buy crops from farmers. Most of the money quickly headed back East to repay loans.
But for a short time, Eastern banks serving Wall Street held less cash than they needed. If a trading firm needed cash to cover large losses, it might not be available because it was on a cart headed West. The firm’s failure, or even fear of failure, could spark a panic.
Harvest season no longer means moving money by rail from New York to Kansas City. But financial markets still show seasonal trends.
Some of these trends are due to business cycles. Retailers, for example, enjoy one strong quarter around the holiday season. This cycle impacts the company’s financials. This can generally be seen in the stock price.
For other companies, new product cycles — or even scheduled trade shows — drive seasonal trends.
As traders, we can spend hours trying to understand why specific seasonals exist. Or we can simply find the trends and trade.
This week, I want to share the latter approach. I searched for the best stocks to own in October. These are stocks to buy early in the month and sell at the end of the month.
How I Found This Month’s Top Stocks
To find these, I tested the stocks in the S&P 500 and checked which ones have the following parameters:
- At least 10 years of data and up to 25 years.
- Winning trades at least 70% of the time.
- Share prices under $200 so that options are affordable.
Then I screened out stocks where one trade accounted for most of the gains. I also eliminated stocks with excessive risk.
After my filtering process, these five stocks passed my screening:
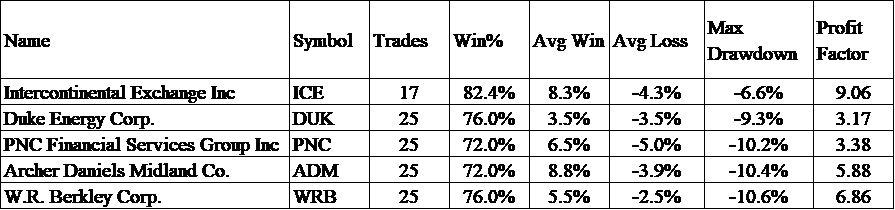
The table above shows how often the trade delivered a gain. And it shows the size of the average win and loss.
It also shows the maximum drawdown, which is the largest loss in any one trade. Drawdowns are higher than losses because stocks often rebound after declines. The drawdown captures the worst moment in the trades.
The profit factor is the ratio of gains to losses. Higher values indicate the gains that significantly exceed losses. Because I eliminated stocks where one trade accounted for more than 25% of the gains, high profit factors indicate the gains are relatively steady.
This is a list of stocks to buy. It’s also a list of stocks that can be used with call options. Calls offer the right to buy a stock at a preset price for a preset time. They generally cost less, often less than 5% of the stock price.
To find October’s best trades, we didn’t need to try and understand why these stocks rallied in October. The why wasn’t important. Our goal is to simply benefit from their bullish seasonal pattern.
Until next time,

Mike Carr
Senior Technical Analyst