
We’re in the first full week of January. If you made New Year’s resolutions, odds are you’re already off track. That’s okay. It’s part of making resolutions.
We tend to start the year with optimism, telling ourselves: “This year will be better.” But then we realize that last year wasn’t so bad … and we settle back into our old routine.
Investors follow the same pattern. They look at results from last year and expect even better ones in the new year.
But as history reveals, it doesn’t always work that way…
A Realistic Outlook for 2024
Data for the S&P 500 Index goes back to 1928. In all that time, the index has beaten its previous year’s return just 42% of the time.
Last year was an unusually good year. The S&P 500 gained more than 23%.
Only 21 years (of those since 1928) were better than 2023. And the next year delivered lower gains 100% of the time. The average gain was less than 5%. That’s about half the gain the index averaged in all other years.
Even worse, there were losses 33% of the time after a big year.
So history tells us to be cautious this year. We see a strong tendency for large gains to be followed by less-than-stellar gains.
Earnings tell the same story.
Analysts also start the year with optimism. They become more realistic over time. This pattern is shown in the chart below. This is Dr. Ed Yardeni’s “squiggles” chart. The blue lines show analysts’ earnings estimates for the year. The trend in almost every single year is down.
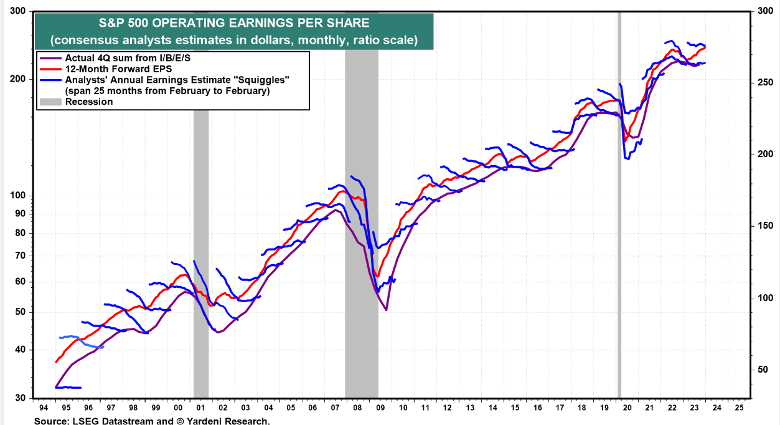
Source: Yardeni.com.
With this in mind, we can project an S&P 500 price target for this year…
Optimistic Price Forecast for 2024
Analysts expect earnings per share for the index to be about $242. That’s about 13% higher than last year. That growth is expected to occur even though sales are expected to be up just 5.5%. In order for that to happen, companies would need to increase their profit margins.
Analysts expect profit margins for 2024 to increase dramatically. In fact, they are looking for margins to be near an all-time high. The record high came in 2021, fueled by inflation.
Getting back to that level in 2024 seems unlikely unless inflation surges. And if that happens, stock prices will collapse no matter what earnings are.
All this means that earnings estimates are likely to follow their historical pattern and decline throughout the year.
But that doesn’t mean current estimates are useless. We can use them to find an optimistic price target for the S&P 500.
Over the past 10 years, the average price-to-earnings (P/E) ratio has been 26.7. That’s higher than the 20-year average of about 22 because the Federal Reserve kept interest rates low for most of the past decade. If we assume rates are returning to their historic average, we should use a P/E ratio of 22, or less, for a price forecast.
With a P/E ratio of 22, the price target for the S&P 500 is 5,324. That would make 2024 a nice year for investors with a gain of about 11%.
We can think of that as the best case.
If sentiment worsens, which seems likely as the presidential candidates start mudslinging, we could see a lower P/E ratio. If the P/E ratio drops 5%, the price target falls to about 5,000.
Remember, earnings are also probably too high. If earnings come in 5% below expectations, the price target is 4,800. That’s about where the S&P 500 is now.
Realistically, we should expect a flat year in the stock market. If we have bad news, we could see a decline.
Of course, we’ll still have winners even if the broad market disappoints. This is a year where the smart stock pickers should be rewarded.
Filtering through thousands of stocks for the most profitable movers is nothing short of challenging. Which is why Adam O’Dell and his team have mastered a system designed to select the best-performing stocks in 2024. They’re following a strategy that has shown to beat the market 300-to-1. To see the full details, click here.