Comparative analysis is simply finding the similarities or differences between two or more things.
I did this a lot when I was a journalist.
Whether it was comparing the performance of one athlete to another or the historical performance of a single team over multiple years.
On the news side, I’d compare budget spending from one year to another.
After shifting away from journalism and into the market, I find myself doing even more comparative analysis.
It’s beneficial to spot trends between two different stocks from the same industry or sector.
I’ve used this approach in tandem with Adam’s Green Zone Power Ratings system as another layer of analysis to determine whether a stock is really outperforming or an anomaly.
Today, I want to compare this recent market run with another point in time.
What I discovered may surprise you…
We’ve Seen This Kind of Run Before
Things have calmed down (kind of) after last week’s election, and the market has been on a tear:
S&P 500 Up 4.4% Since Election Day
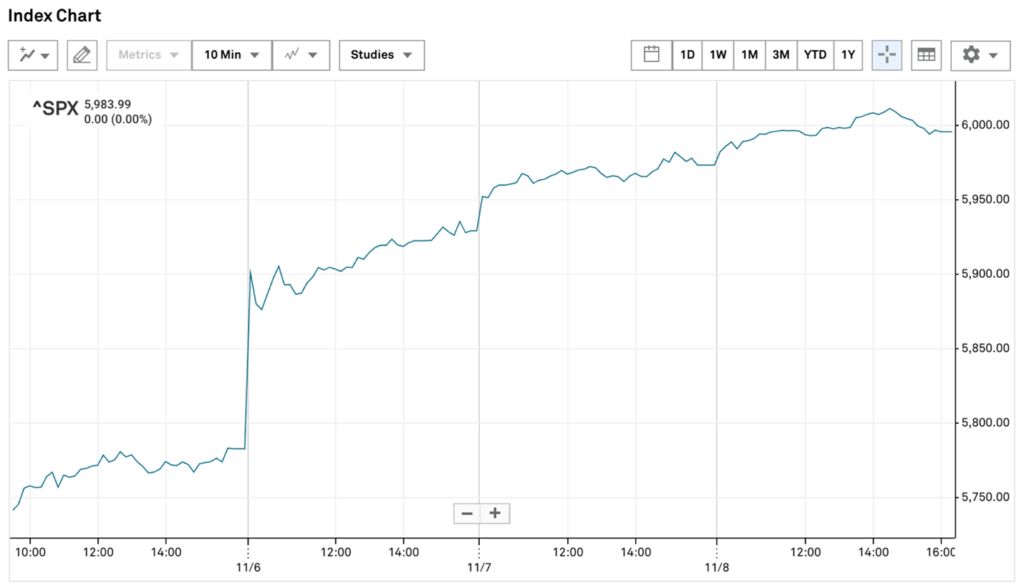
The S&P 500 spiked the day after Donald Trump won the election and has kept running since … to the tune of 4.4%!
The rationale behind the jump is subjective, but I would point out that the market loves certainty, and this election provided just that.
Before we get too ahead of ourselves, market rallies after an election aren’t uncommon. But this much bullish action is rare.
You won’t believe when it happened last…
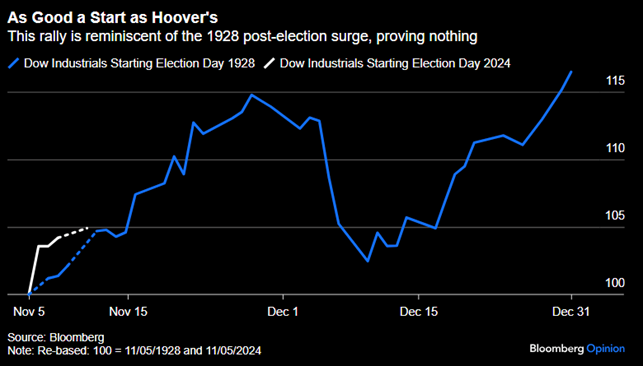
Almost a century ago, in the presidential election of 1928, Republican Herbert Hoover of California defeated New York Democrat Al Smith by a 444-87 margin in the Electoral College.
Republicans gained eight seats to widen their control of the Senate and 32 seats to maintain control of the House.
It was a sweeping win for Republicans, and the market responded with the Dow Jones Industrial Average gaining 6% from Election Day to the Wednesday after.
The bigger surprise is what happened in the four years after Hoover’s election:
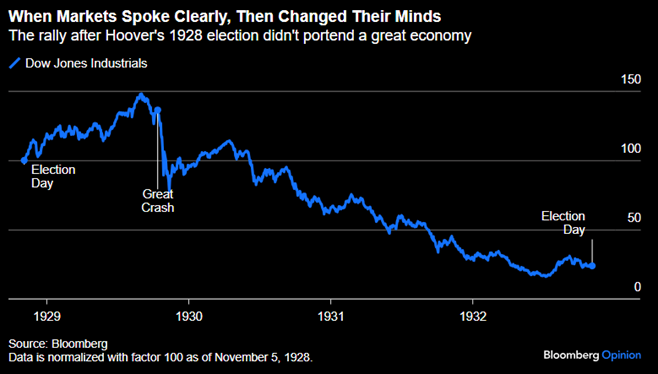
Months after Hoover’s inauguration, the stock market crashed, triggering the Great Depression. The Dow continued to sink to near-record lows before Franklin D. Roosevelt displaced Hoover in the 1932 election.
Past Performance Does Not Equal Future Results
You’ve likely heard the disclaimer when looking at analysis between now and a point in the past.
Just because something happened in the past doesn’t mean it will happen this time around.
The same can be said about this election rally.
In fact, I suggest that the opposite will happen.
In the near term, this rally has legs as the market has pivoted from the Magnificent Seven and into small-cap stocks.
This market diversification will help buoy the rally.
However, there is one thing to keep an eye on … stock market value.
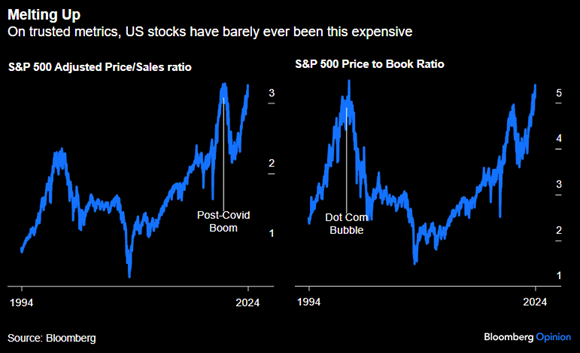
Not since the dot-com bubble or the post-COVID boom have we seen the S&P 500 this expensive.
Again, let me caution that past performance does not equal future results.
Nothing is suggesting the market will fall as it did following the post-COVID boom or the dot-com bubble.
Again, I believe the rally has legs, and several market sectors (like small caps, as Adam mentioned earlier this week) are well-positioned to make significant runs.
That’s the thing with comparative analysis: It’s easy to suggest that because something happened in the past, it will happen again when the stars align.
But in this instance, I don’t see that happening … at least not right now.
That’s all I have for today.
Safe trading,

Matt Clark, CMSA®
Chief Research Analyst, Money & Markets


