
Diversification is a cornerstone of the investment strategies of many investors. To diversify a portfolio, investors, in effect, spread their bets.
In practice, this means buying some tech stocks, some homebuilders and buying stocks in various sectors. There is logic in this since homebuilders should do best when a recession is ending, and tech stocks should outperform as the economic expansion gains strength.
Each sector should outperform at different times, and diversification should steady portfolio returns in bull markets while reducing risk in bear markets.
Right now, diversification isn’t needed. That’s because almost all stocks are going up according to breadth indicators.
Market breadth indicators measure how many stocks are part of a trend.
The breadth indicator in the chart below is the percentage of stocks in the S&P 500 Index above their 200-day moving average (MA).
There are many ways to measure the direction of a stock’s trend. The simplest compares the price to an MA. If the price is above the MA, the trend is up.
Analysts use several MAs with this technique. One of the most popular is the 200-day MA. That MA defines the long-term trend.
For the indicator below, each stock trading above its 200-day MA increases the value of the indicator. It doesn’t matter if the stock is 0.1% above its MA or 20% above. Just participating in the trend pushes the indicator higher.
As the chart shows, more than 90% of stocks in the S&P 500 are in long-term uptrends.
Market Breadth of Stocks Above 200-Day MA
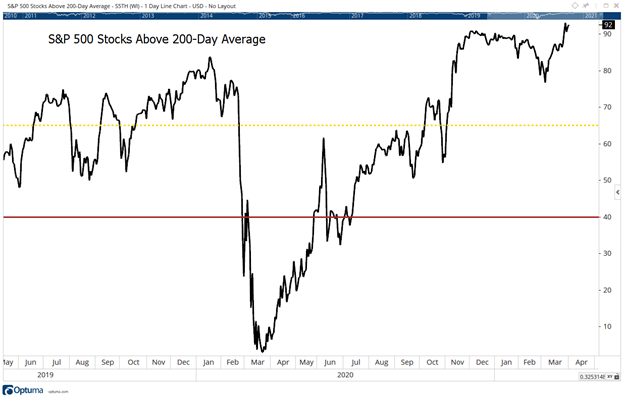
Source: Optuma.
High Market Breadth Could Last Months
This indicator is usually between 40% and 65%. With a reading of 92%, this indicator is at a 10-year high.
To obtain more data on strong market breadth readings, the next chart shows times when the indicator is above 80%.
S&P 500 When Market Breadth Exceeds 80%
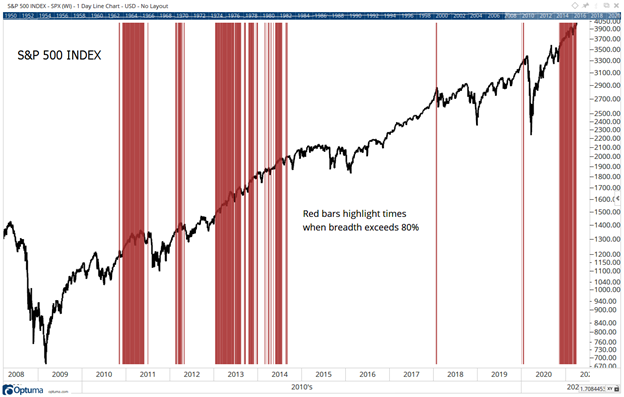
Source: Optuma.
High breadth readings are generally bullish when they first develop. They tend to last for months and coincide with higher prices. Previous rallies lasted eight to 18 months after breadth strengthened.
This signal is just six months old and could last significantly longer.
Is this stupid … or brilliant?
I found a way to trade the markets making the same trade every week.
We do this because any given week, this trade can knock it out of the freaking park.
I recommended 59 of these trades last year. We saw five trades go up 100% or more — each in a week or less.
And a total of 18 went up 50% or more — in an average of two days each.[i]
All told, someone could have doubled every dollar they invested last year trading this way.
I want to give you the same chance.
P.S. I’ve been telling my readers that someone could double their money in a year with this. By the end of 2020, I proved that to be true. My “One Trade” strategy has never had a losing year across 12 years of back testing. And last year’s live results were even better. Click here to see how it all works.
Michael Carr is a Chartered Market Technician for Banyan Hill Publishing and the Editor of One Trade, Peak Velocity Trader and Precision Profits. He teaches technical analysis and quantitative technical analysis at the New York Institute of Finance. Mr. Carr is also the former editor of the CMT Association newsletter, Technically Speaking.
Follow him on Twitter @MichaelCarrGuru.