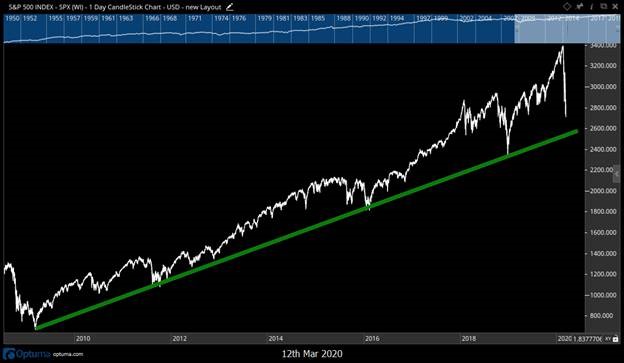
For the second time this week, the S&P 500 “circuit breaker” was triggered after a 7% decline at market open, halting trading for 15 minutes and leaving investors (and perma-bulls looking for a sale) wondering: Where is the stock market bottom?
“It will be hard to be bullish if stocks break the current level of support. As long as the S&P 500 holds above 2,500 by market close today, I’ll continue to play for the bounce.”
Trading was halted at 9:35 a.m. EDT, and the Level 1 circuit breaker was triggered after a 7% dip. Futures trading was halted last night after a sharp 5% drop shortly after President Donald Trump announced travel restrictions from Europe to the U.S due to the coronavirus, known more specifically as COVID-19.
If the S&P 500 declines 13% today the Level 2 breaker is hit, forcing another 15-minute hold on trading. If the index falls a full 20% by 3:25 p.m. EDT, trading is halted for the remainder of the day.
Since Feb. 19’s all-time record close to lunch time on the East Coast today, the S&P 500 (SPX) has cratered a staggering 25%. Since market close on Dec. 31, the SPX is 22% in the red year to date, wiping out almost all of 2019’s gains of 28.9% in a matter of weeks.
Where Is the Stock Market Bottom?

Banyan Hill Publishing CMT Chad Shoop
Banyan Hill Publishing Chartered Market Technician and Pure Income Editor Chad Shoop offered his insight on key levels of support for the S&P 500 regarding what could happen by today’s market close.
“The S&P 500 is trading right at a major long-term support level. In fact, the limit down level of 2,549 is right on it,” Shoop explained. “I’m expecting this major support to hold, and let stocks have a relief rally for a bit. But I’m aware trends can be broken.
“If that happens, my target for the S&P 500 becomes a 50% pullback of all-time highs, around 1,700 points down. It’s a worst-case scenario and it won’t be straight down. But it will be hard to be bullish if stocks break the current level of support. As long as the S&P 500 holds above 2,500 by market close today, I’ll continue to play for the bounce.”

Be sure to follow Shoop on Twitter, where he offers an assortment of tips and market insights, and check out his recent “Bank It or Tank It” segment where he discusses his strategy to profit off the recent panic.
Recent History
To get a feel for the stock market bottom, it’s helpful to look at historical numbers. The stock market bottom of 2009 came on March 9 almost 11 years ago to this day.
From the S&P 500’s peak at 1,565 on Oct. 9, 2007, to its bottom of 676 on March 9, 2009, the index lost 57% in just under a year and a half.
To match that decline from its Feb. 19, 2020, high, the SPX has to fall to 1,900 points, so we’re still about 600-plus above that dubious distinction.
That’s the good news.
The bad news is we’ve already seen a 26% decline, so a little less than half — in less than a month’s time.
Where’s the stock market bottom? Here’s to hoping we’re at it now or will be soon, before the coronavirus-induced bear market turns into one of the worst crashes in history.


