
Editor’s Note: Have you missed any of Mike Carr’s charts in Money & Markets Daily? We’ve got you covered. Monday to Friday, Mike highlights a chart that catches his eye — and what it could mean for markets or the economy going forward. Check out his analysis from the last week below.
Small Business Owners Add to Inflation Worries
The NFIB Small Business Optimism Index fell to its lowest level since 2012 in March. Business owners sharply lowered their sales expectations, and inflation ranks as the leading concern in the survey. A net 36% of respondents expect the economy to worsen in the next six months.
Inflation concerns may be a self-fulfilling prophecy. In March, the net percentage of small business owners raising prices jumped from 21% to 28% — the highest share since October 2023. Another 33% expect to raise prices soon.
Higher prices are the simplest definition of inflation. This data is concerning, but it also raises the possibility that the Federal Reserve will cut rates this year. If the economy weakens as expected in the next months, a rate cut is inevitable.
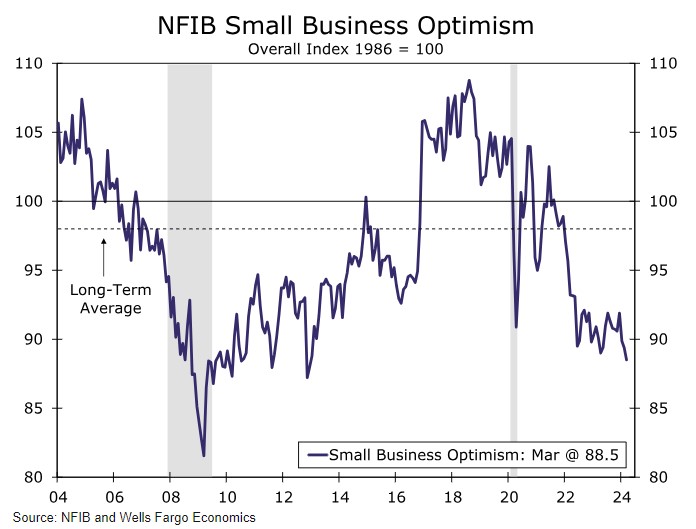
Source: Wells Fargo.
Stock Pros Are Taking Money Off the Table
Investment managers are reducing the amount of stocks they own. We can see this in the chart below. Every week, the National Association of Active Investment Managers (NAAIM) surveys members to find out how much exposure they have to the stock market.
Answers range from 200% for managers who are fully leveraged — to -200% for managers who are fully leveraged to the downside. The NAAIM Number offers insight into how managers are adjusting their portfolios in real-time.
The lower part of the chart shows the S&P 500 Index. Managers tend to decrease exposure as prices fall. The current pattern in the NAAIM Number shows that managers are actively reducing exposure, and in the past, this has coincided with stock market sell-offs.
Bottom Line: This indicator tells us that the stock sell-off could continue for at least a few weeks.
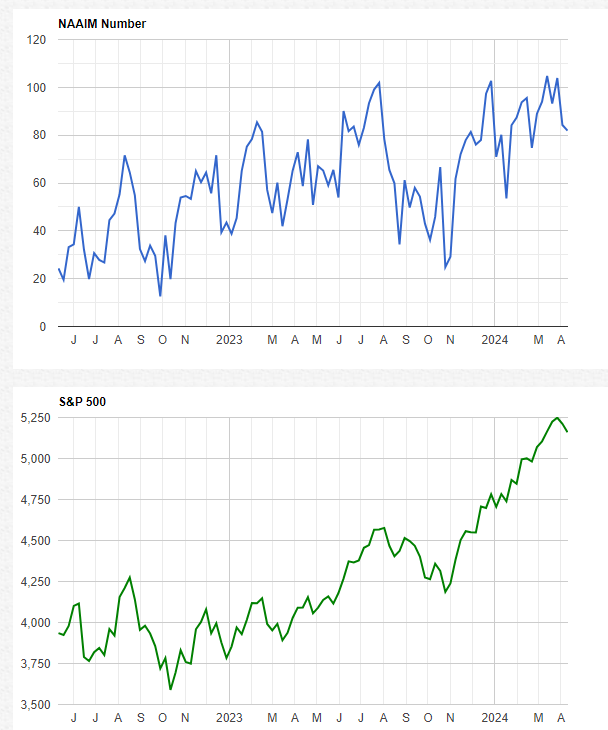
Source: NAAIM
The Market Misinterprets Retail Sales Data
Stock prices jumped at the open this Monday on strong retail sales. The problem is that sales weren’t that strong. According to CNBC: “Retail sales increased 0.7% for the month, considerably faster than the Dow Jones consensus forecast for a 0.3% rise, according to Census Bureau data that is adjusted for seasonality but not for inflation.”
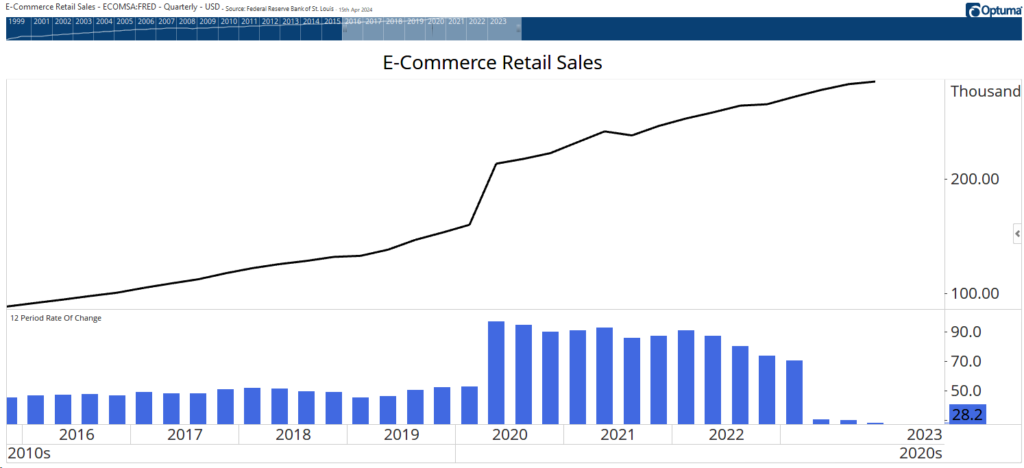
Inflation was 0.4% in March, so a significant part of the increase in sales was simply due to higher prices. Another reason for concern is the slowing growth in online sales. The chart below shows online sales with the year-over-year change at the bottom of the chart.
While a 28.2% increase sounds strong, it’s lower than the pre-pandemic growth level. Much of the March increase came because Amazon held a “Big Spring Sale” March 20-25.
It’s not uncommon for other retailers to run competing promotions concurrent with Amazon’s, and that was a reason to expect an even larger increase in e-commerce sales, especially since there was no sale in 2023, meaning seasonal factors don’t reduce its impact.
Online sales show consumers are running out of spending power, making this month’s data bearish for stocks in the longer run.
Signs of Stress Building in the Labor Market
Despite better-than-expected job creation and a low unemployment rate, employees seem worried about their jobs. The New York Federal Reserve’s Survey of Consumer Expectations Labor Market Survey showed that the number of people searching for a job in the past four weeks reached a 10-year high.
In March, 25.1% of respondents reported they were actively looking for a new job. That’s up from 23.1% in the last survey completed in November 2023. It’s the highest reading since March 2014 when 31.4% were actively job hunting. At that time, the unemployment rate was 6.7% as it continued its slow recovery after peaking at 9.9% in 2009. Then, people were looking for better jobs as the economy recovered.
Now, the reason is less clear. The increase was driven by men, respondents over age 45, and those without a college degree. That data shows economic stress among the lower-paid jobs, the kind that could be cut at the first sign of economic weakness. This is a warning that the strong labor market could be reversing.
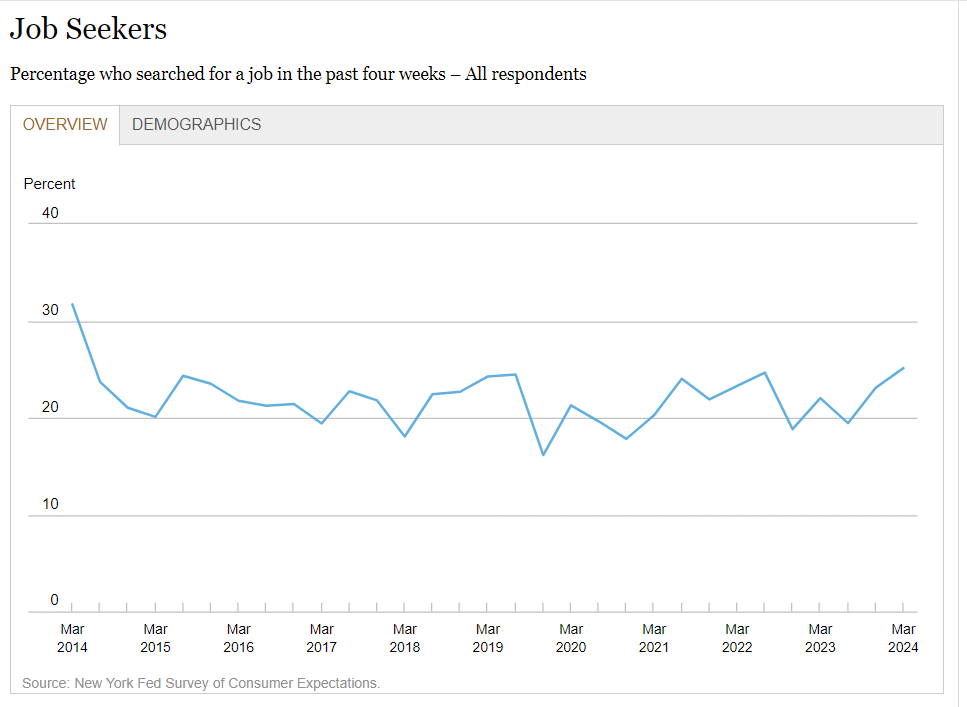
Source: New York Fed Survey of Consumer Expectations
Why Inflation Feels So Painful
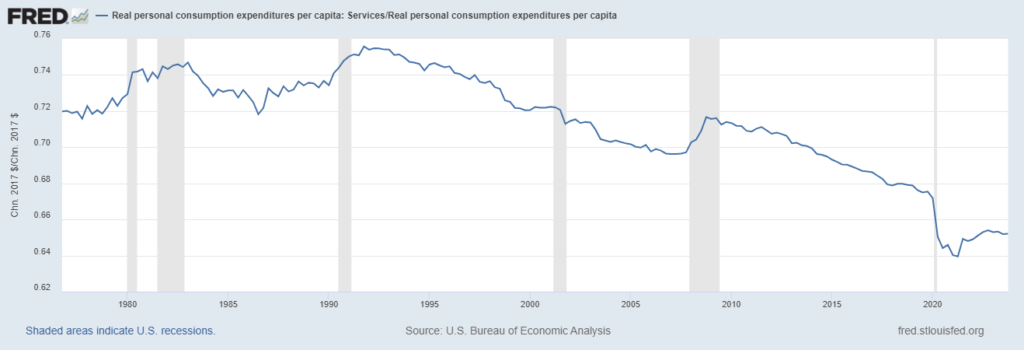
Some politicians insist we have a great economy, and that inflation is low. But most consumers disagree. One reason could be that they feel like they are spending more on services. Before the pandemic, consumers dedicated about two-thirds of their spending to services. This is shown in the chart below, the ratio of spending on services to overall spending.
That spending crashed when the economy shut down, bottoming at 64% of spending in 2021. As prices move higher, services require more of our income. That leaves less to spend at the grocery store where prices are up over 20% in four years … or at the gas station where prices always seem to be too high.
Increasing service prices make us feel poorer and affect our view of the economy. We’ll likely see spending on services continue to grow as the long downtrend appears to have bottomed out.
Spending on Services to Overall Spending Takes a Hit
That’s it for this week’s edition of Chart of the Day.
Until next time,

Mike Carr
Chief Market Technician