Costco Wholesale Corporation (Nasdaq: COST) is in the spotlight after some good news.
Costco CFO Richard Galanti said a membership fee hike isn’t happening.
Most important for me: The $1.50 hotdog and soda combo price will not rise with inflation either.
Hallelujah.
Costco‘s inflation moves might be helping its “Bullish” 80 out of 100 score on our proprietary Stock Power Ratings system.
We’ll take a closer look at the green metrics for this stock before zooming in on its growth and momentum metrics.
First, let’s see what the company’s fan base can tell us about its profits.
What Keeps COST Afloat? Its Members
A recent analyst report stated that COST has a membership renewal rate of around 90%.
In other words, its customer base is extremely loyal.
That is something the company can lean into amid inflation and recessionary fears.
Costco has used its customer loyalty to its advantage throughout the years.
It doesn’t make much profit from selling goods.
It’s kind of like a secret club that makes money from exclusivity.
COST only allows members to shop its aisles and enjoy enticing free samples. This means it’s making money before anyone reaches a cash register.
Let’s see how Costco’s loyal fan base has accounted for its performance through this shaky market.
COST’s Stock Power Ratings Breakdown
For a “Bullish” stock, we’ll focus on the metrics that rate in the green before zooming in on the stock’s growth and momentum ratings.
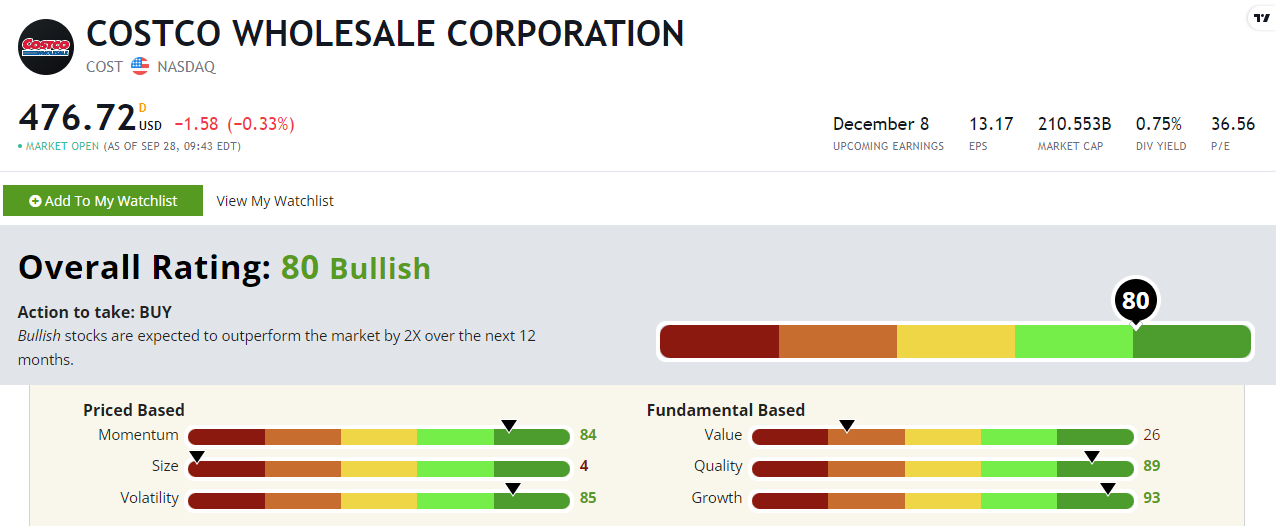
COST’s Stock Power Ratings in October 2022.
- Quality — Numbers explain COST’s quality:
- Its return on assets is 9.47%, compared to its industry peers’ at 0.91%.
- Return on equity is also impressive for COST at 30.59% — almost triple its peers’!
- And its return on investments is at 20.35% against an industry average of 3.34%.
The company knows how to make money. This earns COST an 89 on our quality metric.
- Volatility — Despite a steep fall in May due to market pressures, COST managed to recover with a somewhat smooth upward trajectory throughout August. COST earns an 85 on volatility.
COST’s Momentum
Let’s take a closer look at COST’s stock performance over the last year.
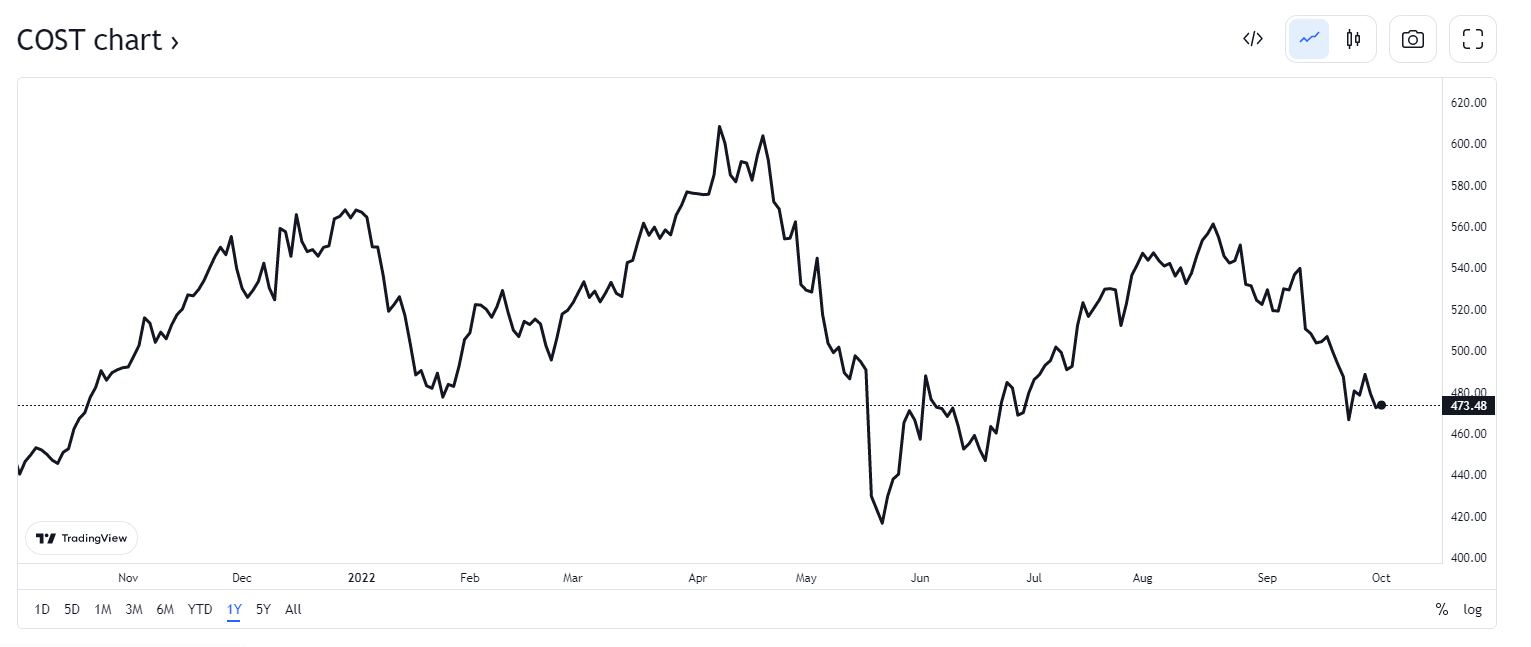
Source: Tradingview.
From its May 2022 low of $415.71 to the middle of August 2022, COST stock jumped 34.9%.
Market headwinds pared those gains back, but it is still up 8.3% over the last 12 months.
Its peers are averaging a 22% loss over the same period of time.
This earns COST an 84 on our momentum metric.
Now let’s look at the highest-rated metric on our system for COST: growth.
COST’s Growth
If you look at growth, COST would be considered a “steady Eddie.”
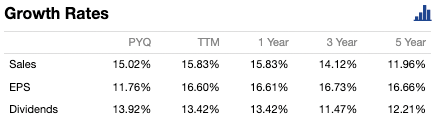
With consistent sales and earnings-per-share growth over various periods of time, COST’s reliability proves it’s earned that nickname.
Also, something to note: COST has a forward dividend yield of 0.75%, paying shareholders $3.60 per share per year.
Speaking of dividends, Co-Editor Charles Sizemore’s latest issue of Green Zone Fortunes discusses one of his favorite income stocks of all time.
Click here to learn more and find out how you can gain access to an entire dividend portfolio!
The Bottom Line
Costco scores a “Bullish” 80 out of 100 on our Stock Power Ratings system.
However, “Strong Bullish” stocks are no anomaly.
We expect those stocks to beat the broader market by 3X in the next 12 months!
To get one highly rated stock you should consider investing in every weekday, check out Matt Clark’s Stock Power Daily.
Monday through Friday, he gives you one stock that scores 80 or above on our system and tells you why you should add it to your portfolio — for free!