As an investor, you may feel a sense of excitement or dread about 2024. It’s not just that a new year brings feelings of hope or despair to many of us. It’s the fact that it’s an election year in the U.S.
No matter how you feel about the choices for president, Senate or Congress, the year carries a special meaning for investors. The presidential cycle is widely followed, and perhaps that’s because it makes logical sense.
Voters choose the president every four years. For some reason, we have wars, recessions and bear markets that always seem to start during the first two years of a president’s term.
But before we may want to start worrying about 2025, history tells us to expect a mediocre 2024.
Take a look at the chart below. It shows the typical performance of the S&P 500 Index (orange line) compared to the typical performance of the index during an election year (blue line).
Election Years = Below-Average Returns
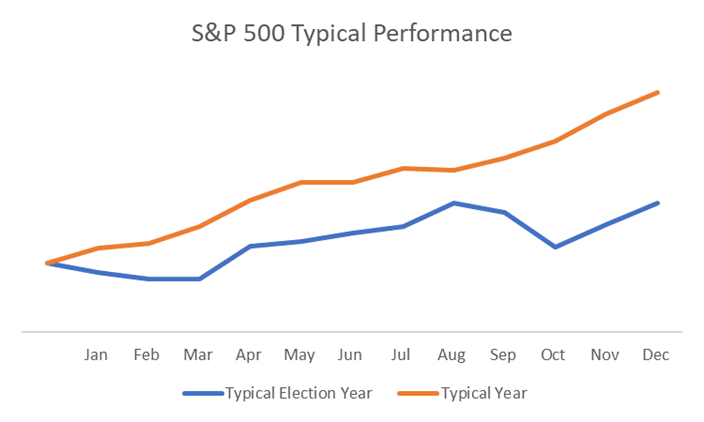
On average, returns lag in election years.
A couple clichés can help us understand the election year pattern.
Stocks tend to struggle in the first few months of an election year. That’s partly because the market hates uncertainty. Until traders see the results of the early primaries, a cloud of uncertainty hangs over the election.
Since the election carries significant consequences for the economy, the tendency for stocks to muddle through the uncertainty is understandable.
We’ll have Super Tuesday in early March. This year, 16 states will hold primaries on March 5, 2024. After that, the nominees should be in focus.
Stocks then rally into the summer conventions. This is where traders “buy the rumor, sell the news,” which explains the autumn sell-off in election years. That’s followed by a rally into the end of the year.
While the chart above shows us the general outline of the election year pattern, the following chart shows the volatility within that pattern.
Election Year Volatility
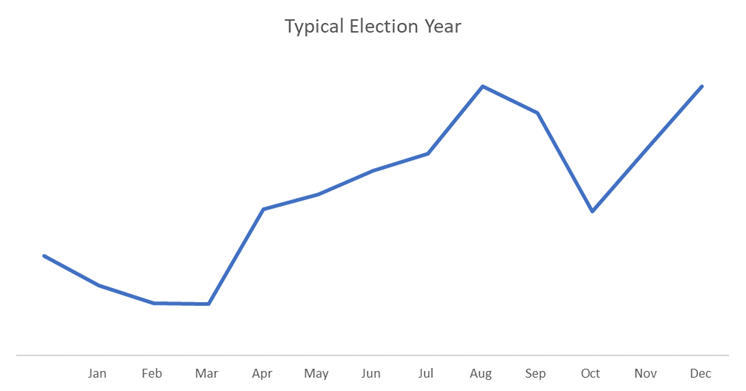
You can see that market volatility settles down as we gain certainty on who’s running at the beginning of an election year. But then, volatility ratchets up in a big way as the final candidates in each party try to win over the nation.
Of course, this time is different.
We know who the nominees are going to be … or, do we? We’re still sitting at 13 potential candidates across all running parties. While it looks like we’re set for Biden versus Trump round two, that’s no guarantee.
How did it play out in the past?
We knew at the end of 2019, before the last election, that Bernie Sanders had strong momentum and was gaining on the eventual nominee, Joe Biden. After Biden finished in fifth place in New Hampshire, the nominee was in doubt.
The dust settled shortly thereafter, and the race was set by the end of March.
We knew at the end of 2015 that Hillary Clinton would trounce Donald Trump if he were nominated.
Going back even further, in December 2007, it looked like two New Yorkers — Hillary Clinton and Rudy Giuliani — would face off in the November 2008 election. Yet neither made it through the primaries.
There are other examples of times when the leading candidates lost the nomination. That explains why we should expect volatility in the markets for 2024.
Here at Money & Markets, the team and I will continue to keep a close watch and fill you in on the best trading opportunities set to unfold this year.
Until next time,

Mike Carr
Chief Market Technician