FANG stocks led the record-long bull market that ended in March.
Sometimes spelled FAANG, the acronym refers to the biggest tech stocks in the world: Facebook (Nasdaq: FB), Amazon (Nasdaq: AMZN), Apple (Nasdaq: AAPL), Netflix (Nasdaq: NFLX), and Alphabet (Nasdaq: GOOG), the parent company of Google.
These stocks account for about 20% of the S&P 500’s total value. Their trends are highly correlated with the index and the broad stock market. Right now, both technical indicators and fundamentals warn of a decline in the group.
NYSE FANG+ Index
The NYSE FANG+ index includes these and other major tech stocks. Its chart is shown below with a 10-day moving average (MA) and the popular MACD indicator. The chart is bearish.
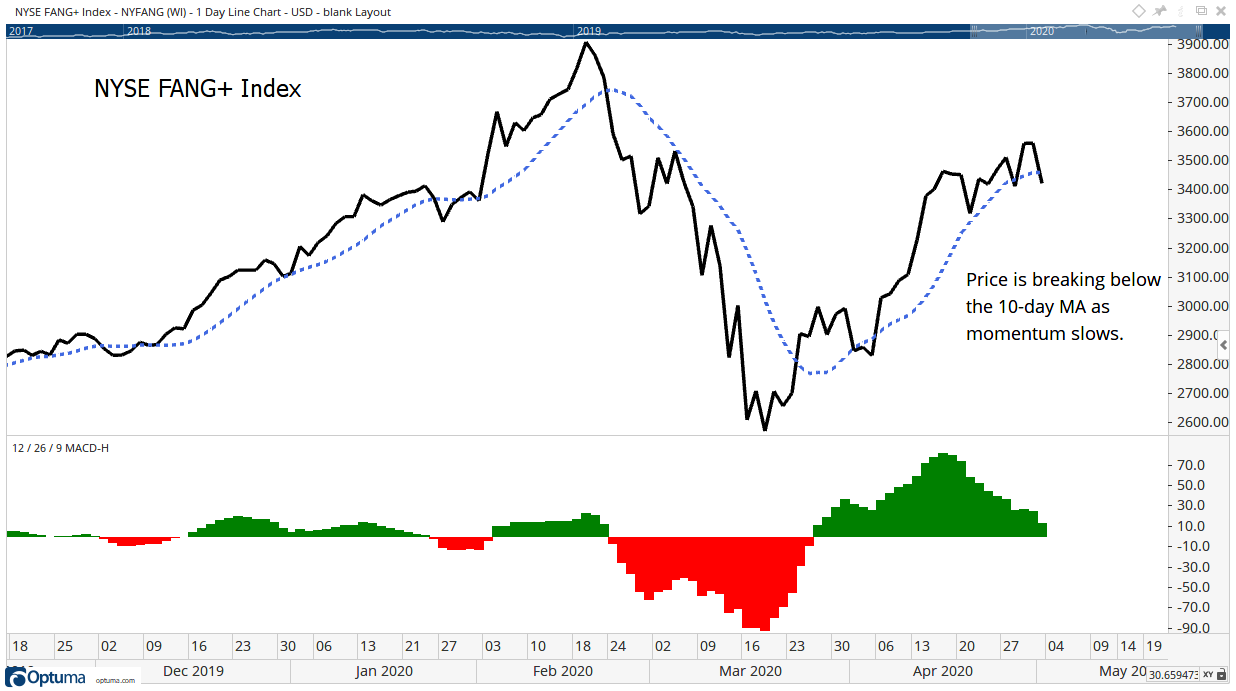
Source: Optuma
The 10-day MA is appropriate for these stocks because traders account for much of their daily market action. Their liquidity and large representation in major indexes make the stocks suitable proxies for index traders.
The NYSE FANG+ index traded near this MA for two weeks, and a decisive break will indicate the uptrend is over.
MACD is a popular momentum indicator. It’s appropriate for these stocks because much of the trading in them is done by individual investors. Individual investors tend to apply popular technical indicators. That makes the imminent sell signal in the MACD important to consider.
These are short-term indicators. Fundamentals tell investors about the long term. Here, the story is also bearish.
On a weighted basis, the price-to-earnings (P/E) ratio of the FANG stocks is about 46. That’s well above the S&P 500’s P/E ratio of 18.
Some investors will argue the higher-than-average P/E ratio is appropriate given the growth prospects for these companies.
That’s incorrect.
The relationship between growth and value can be quantified with the PEG ratio.
This indicator divides the P/E ratio by the earnings growth rate. It recognizes that companies with rapid earnings growth deserve high P/E ratios. A low PEG ratio highlights undervalued opportunities, no matter what the P/E ratio is.
On the other hand, a high PEG ratio warns of overvaluation and this indicator shows that even low P/E ratio can be overvalued.
Stocks trade at fair value when the PEG ratio equals 1. This means the P/E ratio equals the earnings growth rate. For a stock growing earnings at 10%, the P/E ratio should be 10. When earnings growth is 40%, the P/E ratio should be 40.
The FANG stocks are expected to grow earnings at an average of 18% a year, also on a weighted basis.
That makes the PEG ratio 2.6. That’s expensive and indicates the stocks are overvalued, as a group.
With both technicals and fundamentals warning the market leading FANG stocks are due to fall, investors should increase their cash holdings.
• Michael Carr is a Chartered Market Technician for Banyan Hill Publishing and the editor of Peak Velocity Trader and Precision Profits. He teaches technical analysis and quantitative technical analysis at New York Institute of Finance. Michael also is the former editor of the CMT Association newsletter Technically Speaking.