
In 2011, I was assigned what many would consider an “impossible” task.
I was hired by a world-renowned Harvard economist.
He wanted me to develop a system to extract consistent profits from the stock market … and he was uber-bearish on the stock market. He was convinced a major crash was imminent.
See, I’m not a “short-seller.”
Philosophically, I’m a cautious optimist. And by training, I’m a systematic trader focused primarily on the price action of markets — in short; I’m a “quant.”
Now, this economist is brilliant, and his bearish arguments had a ton of merit.
The trouble was, like it or not, we also recognized that the U.S. Federal Reserve was pumping the market with liquidity — essentially juicing the market higher.
Well, in late 2011, I resolved that conundrum by pitching to him a new strategy I’d just developed.
It was based loosely on a sector rotation framework — the idea that the 10 or so sectors of the economy routinely cycle in and out of favor.
And I committed myself to two concepts: a short holding period and a laser focus on price action only.
I recall telling him:
“Look, we’ll never be in a trade for longer than three months. And if the bullish stock market trend starts to turn south … we’ll exit our bullish plays and put on bearish ones.”
Along with an even bolder claim:
“This strategy can make money in ANY market.”
A Home Run Track Record
Like anyone, I feel awkward when looking back and speaking of my successes. I’m not a braggart. And I’d much rather my track record “do the talking.”
So, since 2012, when we first began trading my strategy, I’ve kept a low profile and simply plodded away … issuing one trade recommendation after the next to our loyal following of investors.
It took a junior analyst on my team to assemble this chart of our track record for me to finally realize that my readers have accomplished a remarkable feat over the last decade.
Indeed, they’ve made money in ANY and ALL market conditions.
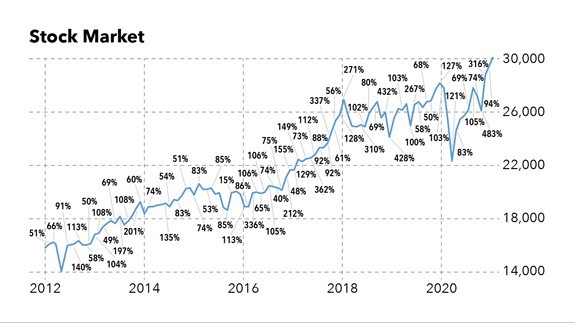
You can see all the wins my readers have had the chance to make in the chart below.
Home Run Profits Wins Since 2012
But look, just as I’m not one to blather away on CNBC about my successes, I’m also not one to rest on my laurels.
I grew up in West Virginia to parents who were the first in their families to go to college. I got my first job when I was 15. I know what hard work is and what it takes to achieve lasting success.
So my focus is never on that chart above. That’s history.
Instead, I wake up every day with a single thought seared into my mind…
How Can I Do Even Better?
 Today, I want to formally invite you to my Home Run Profits event.
I’m super pumped about this event because, over the past six months, I’ve finalized several significant “upgrades” to the system I developed in 2011 … the one that produced the live track record in that chart above.
So while my time-tested strategy has already helped my readers lock in dozens of profits of 100% or greater … I’m now so confident in my latest system upgrade that I’m willing to personally guarantee an average of one 100% winner every month for the next 12 months!
I don’t want to spoil the punchline. You can click here to attend my event for the full details on the strategy, its latest upgrades and my 100%-winner guarantee…
But just to whet your appetite, I can say the upgrade involves the six-factor Green Zone Ratings model for stocks that I developed and integrated into the Money & Markets website last year.
You see, as a Chartered Market Technician and avid “momentum” trader, I’m still a believer in the idea that price action is paramount.
But as an open-minded quant, I’ve continued to keep up with the latest research in the field. And it was undeniable to me that “factor investing” can absolutely lead to consistent, market-beating returns — particularly when we do it in a systematic way.
What Are Factors?
Simply put, factors are characteristics that drive market-beating returns. Stocks that have these characteristics tend to beat the market. Stocks that don’t have them tend to lag the market.
The Green Zone Ratings model I developed considers 75 individual stock metrics, spanning six of the most powerful factors discovered to date. Those are:
- Momentum (Of course, my favorite!).
- Size (how big a company is).
- Volatility (how volatile a stock is … less volatile is better).
- Value (how cheap or expensive a stock is, fundamentally).
- Quality (looking at things like profit margins, debt levels and cash flows).
- Growth (of revenues, earnings and cash flows).
Ultimately, the “best” stocks are the ones that rank favorably on a majority of these six factors. And my research analyst Matt Clark and I can find these “best” stocks with just a few clicks of the mouse.
I’ve already built the system that collects the data, runs the calculations and outputs the ratings, which range from 0 (worst) to 100 (best). And Matt is a pro at delivering to me a “hotlist” of my system’s highest-rated stocks each week.
That’s where the latest upgrade to the strategy I’ve been running since 2012 comes into play…
Rather than following my system’s momentum-based buy signals on just any stocks, I’m now making sure the trade recommendations I sent to subscribers’ inboxes each week are only the highest-ranked stocks in the market.
And that’s why I’m 100% confident my newly-upgraded strategy, Home Run Profits, will more than deliver on my guarantee of at least one 100% winner every month, on average, over the course of your 12-month subscription.
Again, you’ll want to access my event here for all the details on my strategy and how you can become part of my “100% winners” inner circle. It’s really just too much, and too exciting, to explain here.
I’ll see you there!
To good profits,

Adam O’Dell
Chief Investment Strategist, Money & Markets