
Housing prices have been going up. The trend is slowing, but its pace remains rapid.
In its latest report, the S&P 500 CoreLogic Case-Shiller National Home Price Index showed an 18.8% one-year gain through November.
Some analysts noted that was a decrease from the prior month, when prices were up 19% compared to October 2020.
The press release highlighting November’s rise put the change in perspective:
Despite this deceleration, it’s important to remember that November’s 18.8% gain was the sixth-highest reading in the 34 years covered by our data (the top five were the months immediately preceding November),” noted Craig Lazzara, managing director at S&P DJI.
Bubbles worry experts, but the data says that we aren’t in a bubble. The data shows a broad measure of affordability.
No Impending Housing Bubble
The chart below shows the ratio of the median home price to the average per capita income in the U.S. It’s an inexact measure of affordability that shows how many years of income are required to buy the average home.
Median Home Price to Average Per Capita Income
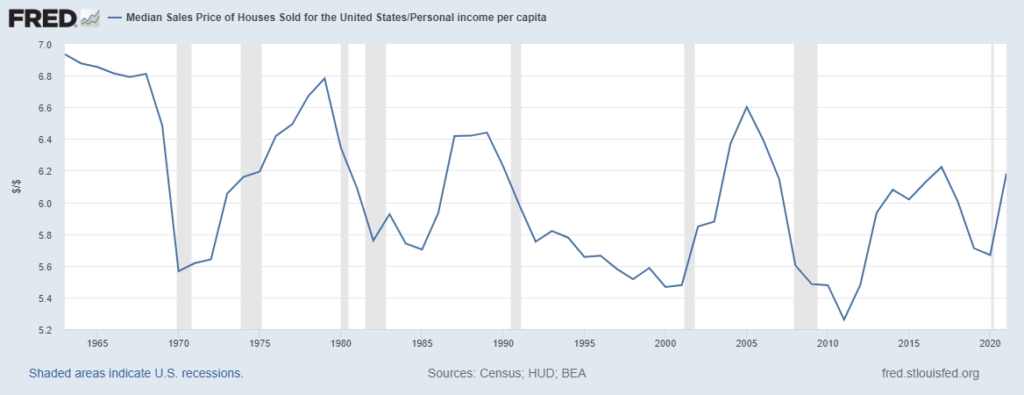
Source: Federal Reserve.
Right now, it takes 6.2 years of income to purchase the average home. The long-term average is 6.0, but values range from 5.3 to 6.9. This stable data series indicates there could be substantial upside in home prices.
Moving just halfway to a new high would represent a 55% increase in the average home’s value, assuming income remains unchanged. But with incomes likely to rise along with inflation, larger home price gains are possible before we need to worry about a bubble.
As always, averages miss individual stories in economic data. Many families struggle to afford houses, and many communities are unaffordable. But, on average, home prices could rise from their current level.
Click here to join True Options Masters.