Analysts are panicking about a potential yield curve inversion. As an indicator, dozens of yield curves measure the difference between interest rates. Is one flashing a warning sign?
Long-term rates are usually higher than short-term rates. That’s because there’s more risk in the long term. When short-term rates exceed long-term rates, the yield curve inverts.
That’s a rare and ominous signal. Yield curve inversions almost always occurs before recessions.
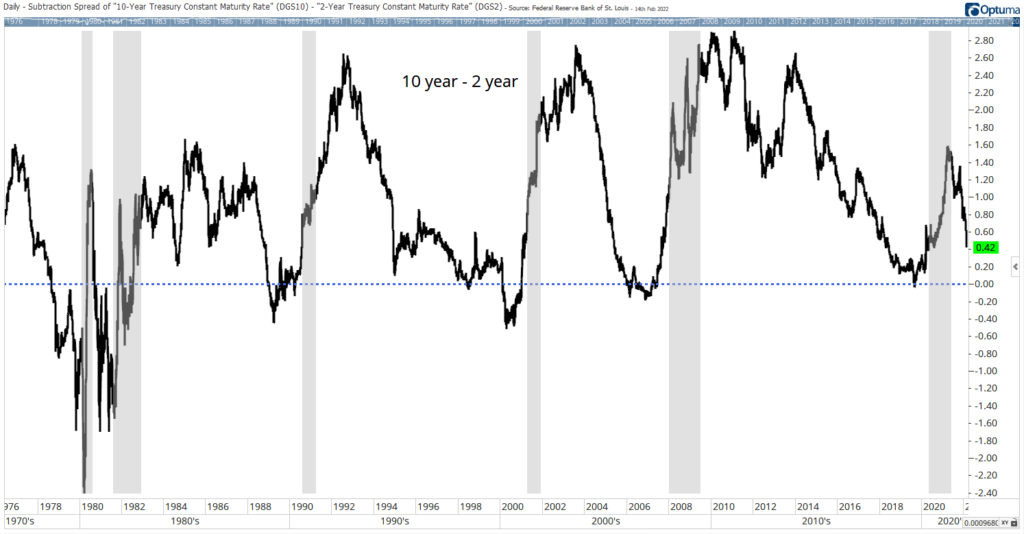
The current panic is because the curve based on 10-year Treasury notes and 2-year Treasury notes is falling. In the chart below, the blue line shows the zero level.
Treasury Notes Yield Curve — 10-Year to 2-Year
10-Year/3-Month Yield Curve Supports Robust Economy
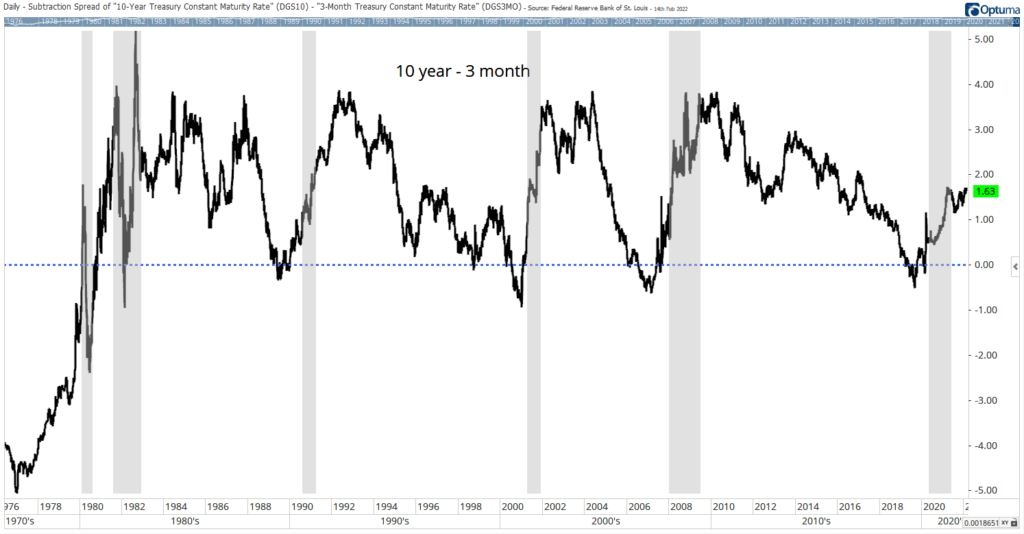
The most popular yield curve is probably the difference between 10-year Treasury notes and 3-month Treasury bills. This is a relationship that has been widely studied. It’s been found to have some predictive value for the economy and the stock market. Federal Reserve economists also monitor this yield curve.
The chart below shows this yield curve, and the picture is one of a strengthening economy. The yield curve is rising and above its 10-year moving average, a sign of an economy likely to grow rather than contract into a recession.
Yield Curve Shows Strengthening Economy
You might have expected the two charts above to reflect similar trends. But there are reasons other than economic growth that can affect interest rates. In bond markets, there is also supply and demand.
When looking at Treasurys, 2-year notes are not as actively traded as 10-years — there is about four times as much volume in the 10-year market compared to the 2-year. Differences in trading patterns explain why different Treasury securities move in different directions at times.
In addition to liquidity, inflation expectations can explain the divergence. Consumers and economists expect inflation to subside over the next 12 months. This means 2-years should carry a higher inflation premium relative to 10-years, affecting the yield curves.
Bottom line: To track recessions and the stock market, it’s best to look at the 10-year and 3-month yield curve. Right now, it’s forecasting a strong economy that should support higher stock prices.
Michael Carr is the editor of True Options Masters, One Trade, Peak Velocity Trader and Precision Profits. He teaches technical analysis and quantitative technical analysis at the New York Institute of Finance. Follow him on Twitter @MichaelCarrGuru.
Click here to join True Options Masters