
The financial press is talking about the dreaded inverted yield curve again.
And maybe you’re wondering: What the heck is a yield curve?!
Every time it comes up, the person discussing it seems so serious.
Well, let’s talk about that.
Here’s everything you need to know about an inverted yield curve and why it matters in your investing journey.
Let’s start with the basics.
The Yield Curve
It’s simple.
If you graph out the current yields on U.S. Treasury bonds of assorted maturities … you have a yield curve!
Most representations of the yield curve start at 30 days and go out to 30 years, representing the full range of bonds issued by the U.S. Treasury:
A Simple Yield Curve
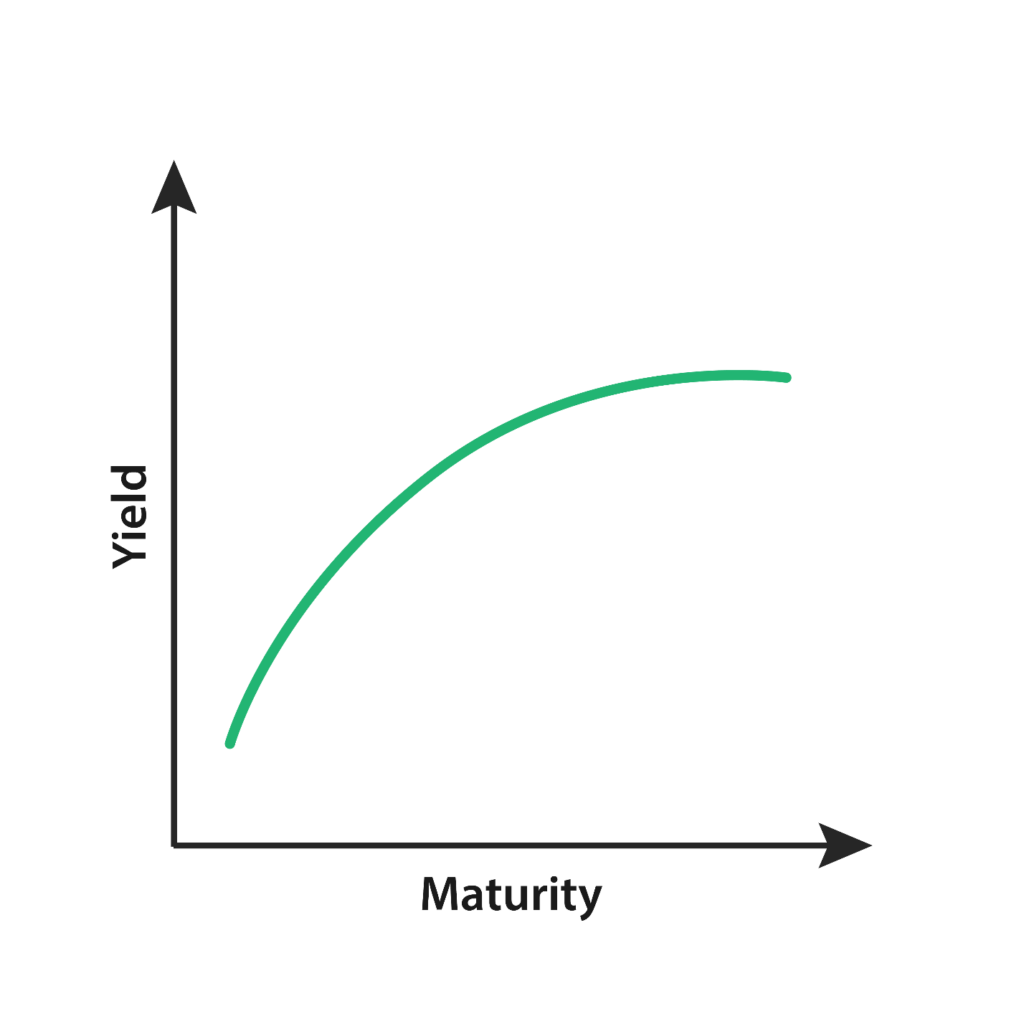
In a “normal” world, the curve slants upward.
Shorter-term rates are lower than longer-term rates.
You see this at your local bank: In most cases, long-term certificates of deposit (CDs) come with higher yields than their shorter-term counterparts.
And a 30-year mortgage rate is going to be higher than a 15-year mortgage rate.
The reasoning is simple: The longer the time to maturity, the less certainty there is, and that translates to more risk.
The higher interest rate is a way of compensating for that risk.
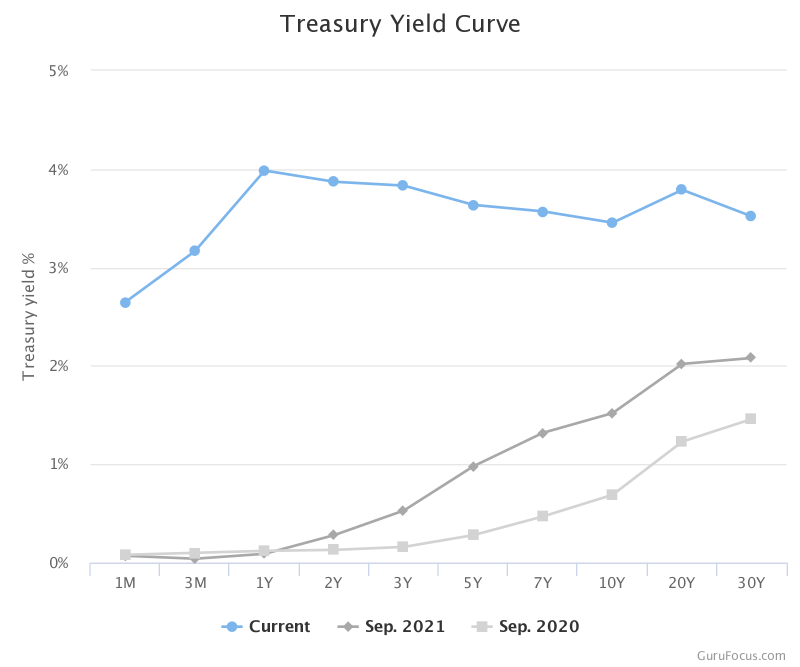
That’s not the situation we see today.
The yield curve is inverted, which means that shorter-term rates are now higher than longer-term rates.
It’s important to remember there’s no right or wrong way to define yield curve inversion. And analysts can pick and choose what rates they look at.
Some analysts compare the 10-year rate to the 2-year rate. Others swear by the difference between the 30-year rate and the 2-year rate or the 30-year and 5-year as better comparisons.
Either way, it’s the same story.
The market is pricing longer-term rates lower than shorter-term ones.
Why Are We Seeing Inverted Yield Curves Now?
There are a couple explanations.
To start, the Federal Reserve tends to focus on its short-term overnight fed funds rate.
The Fed can buy or sell longer-term bonds too. It did quite a lot of that following the 2008 meltdown and again during the pandemic.
The terms for this are “quantitative easing” or “quantitative tightening.”
But at the moment, the Fed is concentrating its tightening efforts on the short-term fed funds rate.
That’s reflected on the shorter-term end of the yield curve.
But at a fundamental level, it comes down to supply and demand.
When demand outstrips supply, prices rise and yields fall.
So when we see the 30-year bond yielding less than the 1- or 2-year note, we know investors are gobbling up every 30-year bond they can find.
That’s the situation we see today.
The 1-year Treasury’s rate is sitting at 4%, about half a percent higher than the 30-year’s.
What Does an Inverted Curve Mean
When investors push long-term yields below short-term yields, it tends to mean one thing.
They’re scared.
An inverted yield curve is a sign of market distress, and investors are pricing in slower growth and lower inflation ahead.
Over time, an inverted yield curve has been a reliable predictor of recessions.
It’s a little ambiguous as to whether the inverted curve predicts recession or causes them.
Investor fear leads companies to cut back on spending and investing, thus created a self-fulfilling prophecy.
I’d argue the inverted yield curve is playing both sides of that debate right now.. Key takeaway: The bond market is flashing major warning signs.
This doesn’t mean you need to sell everything and run for the hills.
But it does mean that you need to think in a more defensive way, keep your position sizes modest and review your stop losses.
It also helps to focus on megatrends.
In Green Zone Fortunes, momentum is one of the six critical factors we consider when recommending stocks.
We like to identify profitable trends that are in place and ride them higher, irrespective of what the market is doing.
Right now, the market is favoring high-yield dividend stocks. That’s where we’re seeing some of the best momentum.
In the September issue, I recommend one of my favorite income stocks. It yields 7% and has raised its payout for 24 consecutive years and counting.
And you can see how to access that ticker, along with everything you need to reinforce your income portfolio by clicking here.
To safe profits,

Charles Sizemore, Co-Editor, Green Zone Fortunes
Charles Sizemore is the co-editor of Green Zone Fortunes and specializes in income and retirement topics. He is also a frequent guest on CNBC, Bloomberg and Fox Business.