
Stocks ended last week with a deep plunge. The decline followed Federal Reserve Chair Jerome Powell’s press conference, where he reminded analysts that millions of jobs aren’t coming back.
That press conference marked the end of a rare chart pattern. The formation began when stocks surged on an error-filled earnings report.
That pattern, an island reversal, is highlighted with a blue rectangle in the chart below.
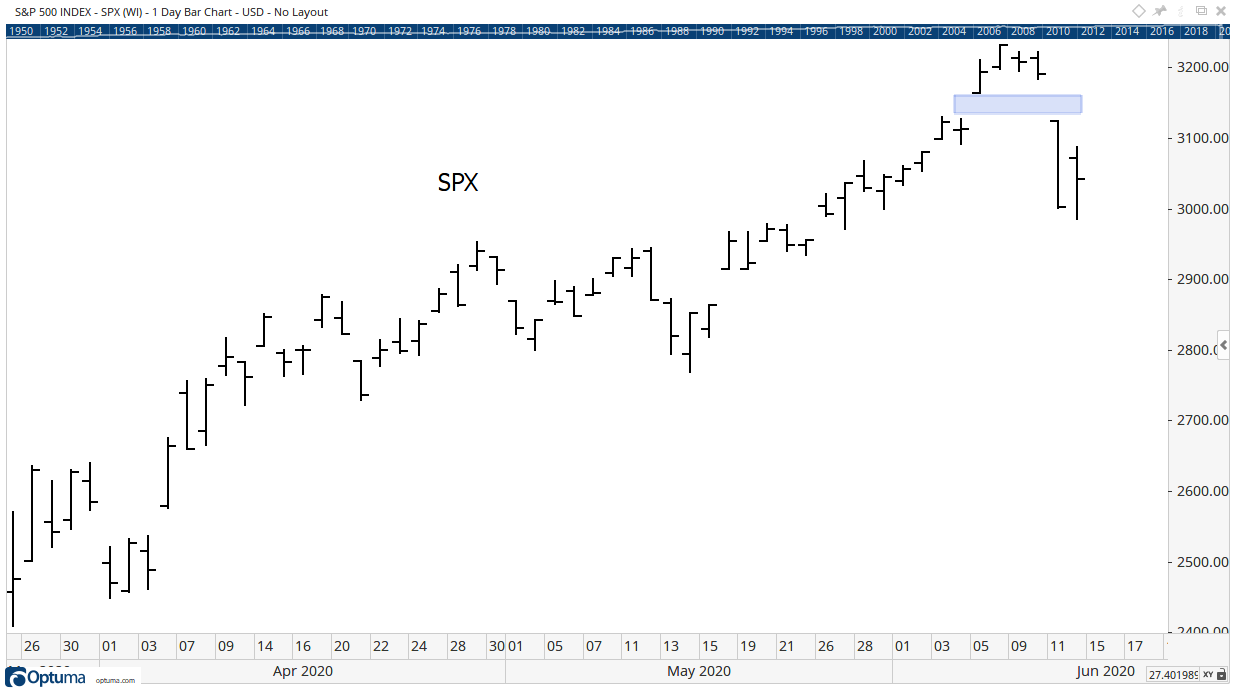
Source: Optuma
The Island Reversal
An island reversal is defined as a “short-term reversal pattern that forms with two overlapping gaps. Traders with positions taken between the two gaps are stuck with losing positions. A bearish island reversal forms with a gap up, short consolidation and gap down.”
The name tells us that we should expect prices to decline after this pattern.
Bearish island reversals are relatively rare on the Dow Jones Industrial Average. This pattern has occurred just six time since 1928 when Dow Jones began providing intraday figures so gaps could be seen on charts.
But that short history shows the pattern is bullish. After an island reversal sell signal, we usually see a brief pullback followed by a surge to new highs.
Unfortunately, six signals don’t provide enough information to develop a trading strategy.
To find a statistically significant sample, I tested the island reversal pattern on all the stocks in the S&P 500, using up to 50 years of data for each stock.
There were 3,096 patterns in that group and the results were mixed. About 48.6% of the time, so just less than half, prices were higher a month later. Average gains on the signal are small, just one-third the average gain of a random entry signal.
In general, returns follow the same island reversal pattern, with a dip followed by a surge in price. Specifically, the pattern doesn’t tell us anything tradable about the direction of the volatility.
Most importantly, testing tells us this island reversal pattern warns of volatility.
The next month is likely to include both a large down move and a big gain.
Volatile markets are best for trading. Rather than taking long-term positions, now is an ideal time to look for short-term profits. Consider put options on stocks that are breaking down and call options on the market leaders. Take gains quickly and limit losses by trading small positions.
There will be an opportunity to take long-term positions later this year, after the volatility subsides and the fundamentals show some improvement.
• Michael Carr is a Chartered Market Technician for Banyan Hill Publishing and the Editor of One Trade, Peak Velocity Trader and Precision Profits. He teaches technical analysis and quantitative technical analysis at New York Institute of Finance. Mr. Carr also is the former editor of the CMT Association newsletter Technically Speaking.
Follow him on Twitter @MichaelCarrGuru.