Interest rates on 10-year Treasury notes are at about 1.6%. Yields have been low for years as the Federal Reserve responded to a weak economy with innovative programs to hold down interest rates.
But the strengthening economy and fiscal stimulus pouring out of Washington could be changing that. Market prices and history indicate rates on 10-year notes are likely to top 3% relatively quickly.
This forecast is based on the yield curve, an indicator that measures the difference between interest rates. There are dozens of yield curves. The most popular is probably the difference between 10-year Treasury notes and 13-week Treasury bills.
Long-term rates are usually higher than short-term rates. That’s because there’s more risk in the long term. When short-term rates exceed long-term rates, the yield curve inverts. That’s a rare and ominous signal. It always occurs before recessions.
In the chart below, the blue line shows the zero level. When the yield curve is below zero, it’s inverted. An inversion occurred before the last recession, and the curve is now climbing.
Treasury Yield Curve Over 3 Recessions
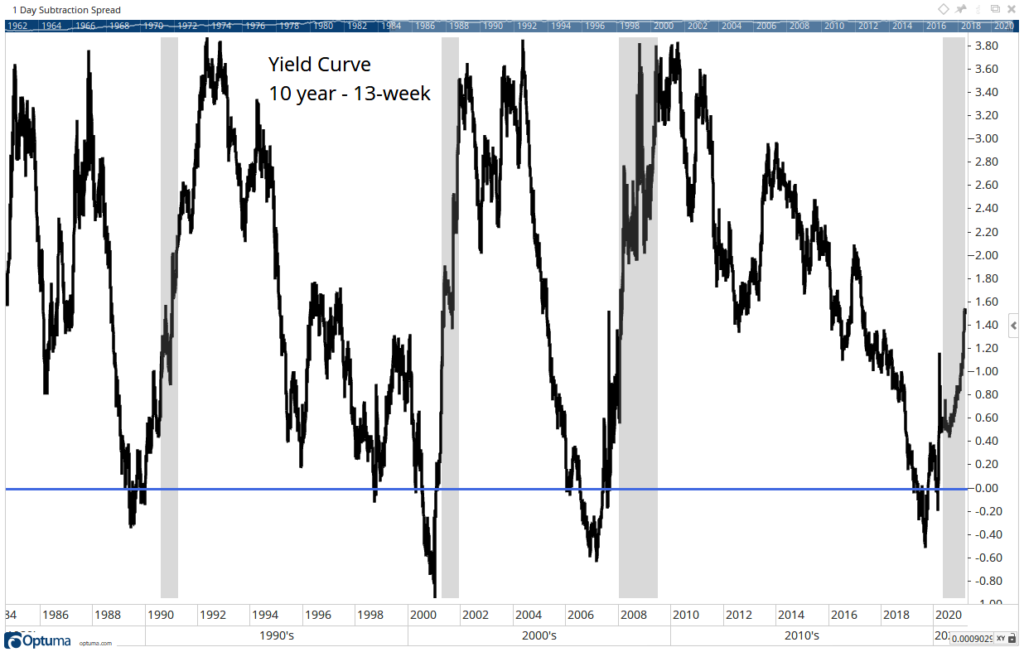
Source: Optuma.
Bond Yields Could Lead to Stock Sell-Off
The chart shows the past four recessions as gray bars. The yield curve behaved similarly after the last three recessions.
The inversion ended before the start of the recession. It climbed quickly during the economic contraction. After the recession ended, the yield curve topped 3%.
When the yield curve exceeds 3%, that means interest rates on 10-year notes are at least 3% higher than the yield of short-term bills.
Bills offer 0.025% now. Fed policy is keeping short-term rates near zero. Assuming Fed policy remains the same, as Fed Chairman Jerome Powell indicates it will, that means yields on 10-years are headed to 3%.
At that level, mortgages would be near 5%. Mortgage-backed bonds would be more attractive than stocks, and that would lead to a sell-off in the stock market.
Yields are important for investors to consider. Yields are warning the stock market could be treacherous soon.
I’m not quitting anything…
I’m just showing people a new way to make money in the markets.
My typical approach targets setups in individual stocks. With roughly 3,000 U.S. stocks, there’s plenty of opportunity.
But my new approach has simplified everything and boiled the markets down to one repeatable trade in the same ticker symbol.
The annual return was 132% last year. Click here to see how we did it. And most importantly, how it could benefit you.
Michael Carr is a Chartered Market Technician for Banyan Hill Publishing and the Editor of One Trade, Peak Velocity Trader and Precision Profits. He teaches technical analysis and quantitative technical analysis at the New York Institute of Finance. Mr. Carr is also the former editor of the CMT Association newsletter, Technically Speaking.
Follow him on Twitter @MichaelCarrGuru.