Investors often take a short-term view of the stock market without meaning to. If asked, many investors say they focus on the long term.
But we all get distracted by news which is focused on the short term. Every day, headlines show investors the gain or loss in major market averages and attribute the change to specific news.
In this environment, it’s easy to miss bigger trends. To avoid that, it’s helpful to look at the stock market from a longer-term perspective.
The chart below shows weekly data for Invesco QQQ Trust (Nasdaq: QQQ). This exchanged-traded fund contains holdings in 100 of the most innovative publicly-traded companies like Apple Inc. (Nasdaq: AAPL), Amazon.com Inc. (Nasdaq: AMZN) and Nvidia Corp. (Nasdaq: NVDA).
This chart should make long-term investors nervous.
A Rare Sell Signal for QQQ
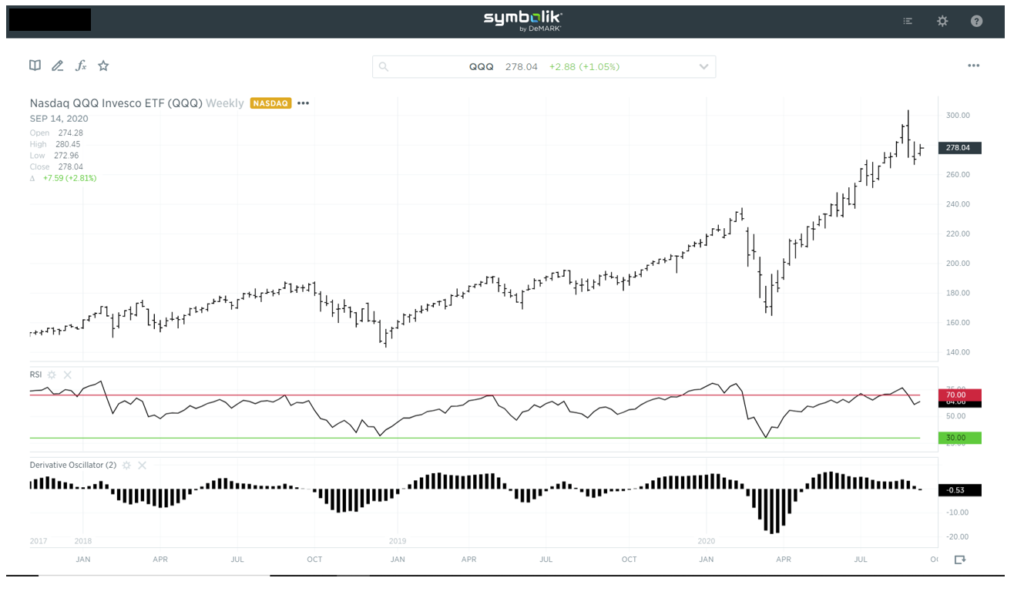
Source: Symbolik
In the middle of the chart is the relative strength index (RSI), a popular momentum indicator. RSI moves between 0 and 100. RSI gives a sell signal when it drops below 70. A buy signal is as a move above 30. There have been no buy signals in the last three years.
Although RSI is popular, it’s not always useful. The indicator rarely gives signals. That makes the recent sell signal, just the third in three years, important to consider.
How Long-Term Investors Can Use the RSI Sell Signal
Previous sell signals came before significant sell-offs.
At the bottom of the chart is the derivative oscillator. This indicator, in technical terms, applies a Moving Average Convergence Divergence (MACD) calculation to RSI. In simpler terms, the derivative oscillator takes two moving averages of RSI and charts the difference between those two values.
The derivative oscillator is designed to provide more signals than the traditional RSI, and its signals tend to be timely.
The recent decline in QQQ preceded the sell signal in the derivative oscillator which turned down this week. All five previous sell signals shown in the chart were followed by declines in QQQ.
It is possible this time is different. But if the price action responds like it has in the past, QQQ is likely to decline in the coming weeks.
Long-term investors can ignore day-to-day gyrations in the stock market. But they should take note of signals on longer-term charts like this one.
Michael Carr is a Chartered Market Technician for Banyan Hill Publishing and the Editor of One Trade, Peak Velocity Trader and Precision Profits. He teaches technical analysis and quantitative technical analysis at New York Institute of Finance. Mr. Carr also is the former editor of the CMT Association newsletter Technically Speaking.
Follow him on Twitter @MichaelCarrGuru.