Long-term value investors often consider metrics like the cyclically adjusted price/earnings (CAPE) ratio. CAPE adjusts the popular P/E ratio to account for inflation and the business cycle.
As my colleague Charles Sizemore recently explained: “The CAPE compares current stock prices to a 10-year average of earnings. The idea is that, over a 10-year window, you’re likely to see a boom, a bust and everything in between.”
Like other value metrics, low readings tend to identify better investment opportunities.
U.S. stocks are among the most expensive in the world, based on CAPE. The current value of 26.7 is more than 50% above the long-term average of 17.
Charles also noted that South Korea is a low CAPE country. It had one of the lowest values in the world at 11.2.
Unfortunately, value is not a timing tool. Even if CAPE is low, it can go lower. Buying too soon leads to a “value trap.” This trap springs when the price drops even lower, or just doesn’t move much at all, and the investor feels trapped.
There is one way to minimize the risk of a value trap. You could wait for the price to stop falling before buying. This isn’t as easy as it sounds. In fact, it isn’t easy at all.
But it’s possible to buy when it’s likely that prices stopped falling.
Avoid Value Traps of 1 Low CAPE Country
Using technical indicators that measure momentum can identify low risk entry points in value stocks. But this strategy also presents challenges. One problem with using momentum indicators is that they often deliver incorrect signals. Using monthly data to calculate the signals can decrease that risk.
The chart of iShares MSCI South Korea Capped ETF (NYSE: EWY) below shows that. This ETF tracks the South Korean stock market, a market with one of the lowest CAPE ratios in the world.
EWY just gave a buy signal on the MACD indicator shown at the bottom of the chart.
South Korean Stock ETF Gaining Steam
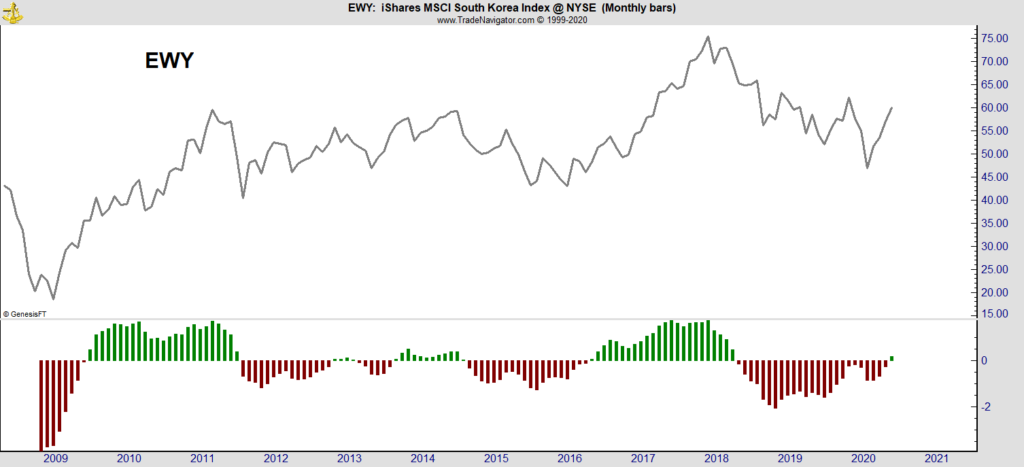
MACD is a popular momentum indicator. It measures how rapidly prices rise or fall. It’s commonly shown as a bar chart centered on zero. Positive values are shown as green bars (buy signals), while negative values (sell signals) are shown in red.
The recent MACD buy signal shows it could be the ideal time to buy into the value that South Korean stocks offer.
• Michael Carr is a Chartered Market Technician for Banyan Hill Publishing and the Editor of One Trade, Peak Velocity Trader and Precision Profits. He teaches technical analysis and quantitative technical analysis at New York Institute of Finance. Mr. Carr also is the former editor of the CMT Association newsletter Technically Speaking.
Follow him on Twitter @MichaelCarrGuru.