
If investors were drivers, we’d all crash our cars from spending too much time staring in the rearview mirrors…
Seriously.
It’s currently March 18, 2026. A bleary-eyed day after St. Patrick’s Day — or Reuben Day, as I like to call it. We’re a quarter of the way into a wonderful new year, and the whole economy is in the middle of a massive transformation.
Yet, instead of noticing this transformation and beholding this awe-inspiring sea change event, most investors are still living in the past. They’re laser-focused on the “Magnificent Seven” tech stocks, hoping against hope that the easy money days of early AI profits might return after a six-month hiatus.
We’re already living in a new world, folks. The Trump Cycle is upon us.
Hit that video link below for the full story:
Video transcript:
I’m Andrew Zatlin, welcome to Moneyball Economics.
For the longest time, I’ve been sharing with you my belief that we are at the early stages of what is going to prove to be a major economic growth cycle, one I call the Trump Cycle.
And I also shared with you that I believe that the economic data that supports this view would start to emerge in March and April for a variety of reasons that I’ll talk about.
What’s interesting to me is, in fact, that economic data has emerged. It does point to a gathering growth that we are indeed at an inflection point, which if I’m right, has big, big impact on both the stock market and the bond markets.
But what puzzles me right now is when I look around, the so- called experts out there either don’t see this data or worse are misreading it.
So today, I’d like to share with you the case for why I believe that we are at the beginning of what is going to be a major rally in the stock market and problems for the bond market, because this economy is set to rage…
Now, at this point in time, you’re probably saying, “Okay, well, let’s talk about the economic data that’s recently come out. And let’s start with GDP because GDP is supposed to be the be-all and end-all measurement of economic activity.”
And the latest read we have is for the fourth quarter. And folks, it was horrible. Let’s face it, if you’re seeing decent economic growth, you would expect GDP to be about 2%. Fourth quarter came in at 0.7%. Not exactly a sign of this emerging growth that I’m talking about.
And yet, let’s take a step back. First of all, that was three months ago, economic activity, end of the year stuff. But more critically, it’s not that it’s old and possibly outdated. It’s that it had the major federal government shutdown. L
et’s talk about that. We had the government shut off for almost seven weeks, and that is totally obvious when you look at the federal government component of GDP. So if GDP was at 0.7% all in for the quarter, it was brought down 1.1% by the lack of federal government spending. So if we hadn’t had that shutdown, we’d easily be at 1.8%, but it gets even better.
Because remember, when the federal government shuts down, it has a lot of downstream impact on state and local spending.
So again, had we not had it, boom, now we’re back above 2%. And that doesn’t even take into account what’s going on in the private sector.
Again, when you’re not paying people, when you’re not spending money in the economy at large, the private sector also responds.
In other words, if you go beyond that headline number, what you see is the economy’s doing just fine. There was no pullback. Now, another read of the economy’s payrolls.
And here, it’s really weird what’s going on. They released a new model for payrolls. And so in the month of January, we had a super strong number. Payrolls grew about 170,000. And then we get to February, suddenly payrolls come down 92,000. Hey, let’s add it up. Kind of limping along on average about 40, 50,000 per month payrolls.
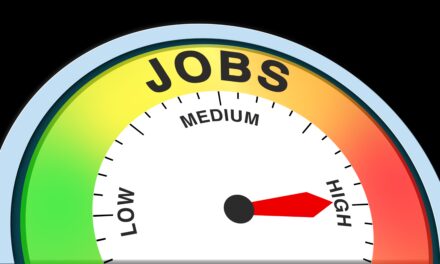
What’s interesting to me is, let’s put aside whether or not that’s the right number. What’s interesting to me is first of all, when I dig into those numbers, again, I see this gathering strength. I see it, for example, in the construction industry where I’m seeing slowly, slowly, slowly, there’s growth going on in the subsectors in the construction world.
And more critically, I see it taking place in the manufacturing space. That’s right. I’m starting to see in the manufacturing space growth in jobs. We have gone through in effect a major shrinkage of jobs in the manufacturing sector that’s now shifting and we’re seeing growth.
And in fact, I believe that we’re seeing that growth in multiple different places. The phrase “green shoots” comes to mind.
This idea that what I’m seeing a year after the tariffs took hold is in fact some onshoring of manufacturing. And with that onshoring of manufacturing, it’s pulling even more downstream jobs forward. So in essence, we are in a very lean economy that is now growing. I’m seeing that growth, for example, reflected in jobless claims.
Let me position payrolls and jobless claims because they’re two different things, even though they’re looking at what’s going on in the labor market. Remember, the labor market’s key here. Let me take a step back. The reason we care about the labor market, yeah, it tells us it’s kind of a relationship to what’s going on in the broader economies, both the tail and the dog. If companies are hiring, you’re going to see labor demand.
And at the same time, if you see a lot of jobs and a lot of labor activity, guess what? It’s going to pull the economy forward as well because people are going to be spending.
Well, let’s cut to the chase. We’ve got payroll’s not looking especially strong. We’ve got jobless claims looking very strong. Jobless claims falling back down below 215,000 and likely to stay there for some time. What’s going on, I believe fundamentally is a process of the way these numbers are pulled together.
Jobless claims are a super robust number. They call me Mr. Jobless claims because I’m the most accurate guy out there forecasting it. Jobless claims means someone came in and said, “I don’t have a job.” Okay. It’s not modeled. It is what it is. Payrolls are fudged data. Payrolls are guesstimates. And they change a lot month to month simply because at the first pass, barely one third of surveys are responded to.
And then you get a couple more surveys responded, so you get a couple more responses. That matters in February when we had all these major storms. A lot of companies didn’t respond. I believe in essence that the latest February payroll data is actually a little bit stronger than what was released. But nevertheless, let’s talk about the difference between fourth quarter and first quarter.
Why, for example, did I say it would take till March and April for the economic data to turn positive? Well, it’s because of human behavior. At the end of the fourth quarter, nobody’s hiring. We got vacations going on.
And companies in particular, public companies don’t want to bring on people. They don’t want to spend money. They want to make that fourth quarter earnings that total fiscal year result looks so super positive. It’s window dressing. But you come to January and February, and now they’ve got new budgets.
Now they’re able to hire.
Now their performance and focus is different.
It’s like Groundhog Day…
The Groundhog sticks its head up. Everything looks sunny. Come out and play. And that’s exactly where we are. That’s part one, the behavior that things wind down in the fourth quarter and then they start to come back to life in the first quarter.
Why March and April? It’s timing. March data tends to look at what’s happening in January and February. So it’s only just getting a whiff of what’s going on. It’s April data where it’s firmly into the new year, into the new growth cycle.
And let’s remember, folks, this time last year, we had tariffs that were just driving everybody crazy. Now we’ve got a situation where inventories are too lean. That’s why manufacturing’s kicking in, for example. We have a growth cycle kicking off. It is getting more and more reflected in the data.
Here’s the situation though.
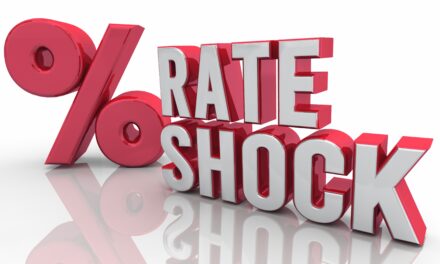
Everyone’s expecting a rate cut.
I don’t think we’re really going to get more than one this year. In fact, as I’ve been raising my hand, we’re going to get rate hikes either at the end of this year or early next year. In fact, turns out that some of consensus is starting to come around to my view.
The latest read is that 20% of folks out there expect a rate hike at the end of this year. Why this matters? Why does my rate of the economy matter so much? If I’m right, if the economy’s growing, then the need to cut rates goes away.
And if the need to cut rates goes away, then the next question is, when is the next rate hike? Now, in the short term, if you’re in the stock market and you see economic growth, that means you’re going to see a lot of margin growth.
You’re going to see a lot of profit. Stocks are going to take off. Good news will be good news, but for the bond market, it’s going to be bad news because again, the odds of more rate cuts go down.
And in fact, a rate hike is going to lower the price of bonds. So be prepared for these waters to be choppy going forward. Me, I’m all about a stock market rally because I’m all about economic growth this year. We’re in it to win it.
Zatlin out.

Andrew Zatlin
Editor, Moneyball Economics