

Companies are crushing expectations at an impressive clip in the first half of this busy earnings season.
Eight of the 11 S&P 500 sectors have reported year-over-year earnings growth. The estimated earnings growth rate for this quarter is 3.5% — more than double U.S. GDP (1.6%) for the quarter!
If things hold, it will mark the third straight quarter of year-over-year earnings growth.
But these reports tell us much more than just what a company is earning.
Taking a deeper dive, specifically into tech earnings, shows me that profits are on the rise and investment in AI is the reason.
I also found an indicator that tells me we are on the verge of an explosion in AI demand.
Let me show you…
Tech Net Profits Moving Higher
It’s easy to see what a company earns and how it earned it, but I like to look deeper at the balance sheet.
For one, I want to see a company’s net profit margin. This shows how much of each dollar a company collects as revenue translates into profit.
More profit means more cash to spend on research and expansion.
And certain sectors are raking in profits at an impressive clip.
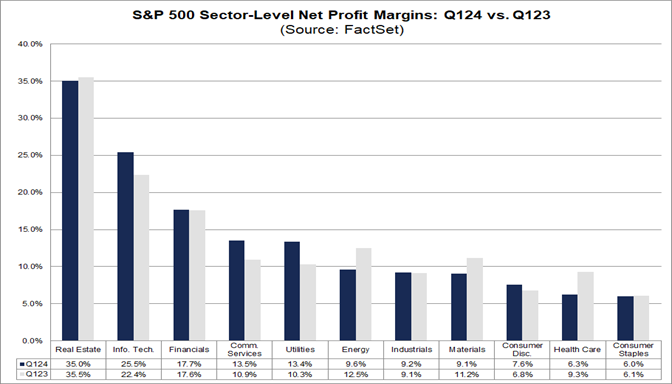
Real estate leads the pack, which makes a ton of sense, considering how much prices have ballooned alongside interest rates. But I want to focus on the second bar from the left in the chart above…
Information technology net profit margins grew from 22.4% in the first quarter last year to 25.5% in 2024. But why?
For one, Big Tech companies like Google, Amazon, Apple and Cisco have slashed staff in an effort to control operating and overhead costs.
It worked as Google’s net profit margin jumped from 21.6% in March 2023 to 29.4% in March 2024. Likewise, net profit margins at Amazon, Apple and Cisco all jumped three percentage points or more, year over year.
Most recently, Amazon posted a 13% increase in its Q1 2024 revenue. Profits also surged to $10.4 billion thanks to growth in its cloud computing unit.
These higher net profit margins give Big Tech companies more flexibility to invest in new technology, more personnel or mergers and acquisitions, as I’ve touched on recently.
But one indicator shows just where Big Tech is spending its excess cash…
Tech Spending Focuses on 3 Areas
The S&P Global Market Intelligence U.S. Technology Demand Indicator is a survey to show companies’ intent to spend on technology.
It recently hit a mark not seen in two years:
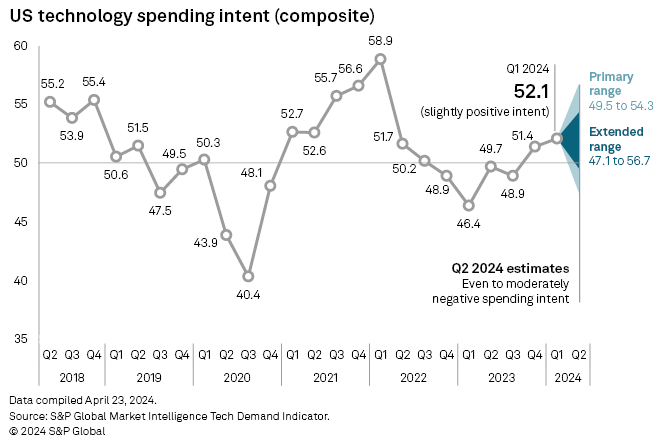
The indicator reached 52.1 … a 12% jump from the same time a year ago and the highest reading since the first quarter of 2022.
Tech spending is on the rise.
What’s more important is what companies are planning to spend their money on:
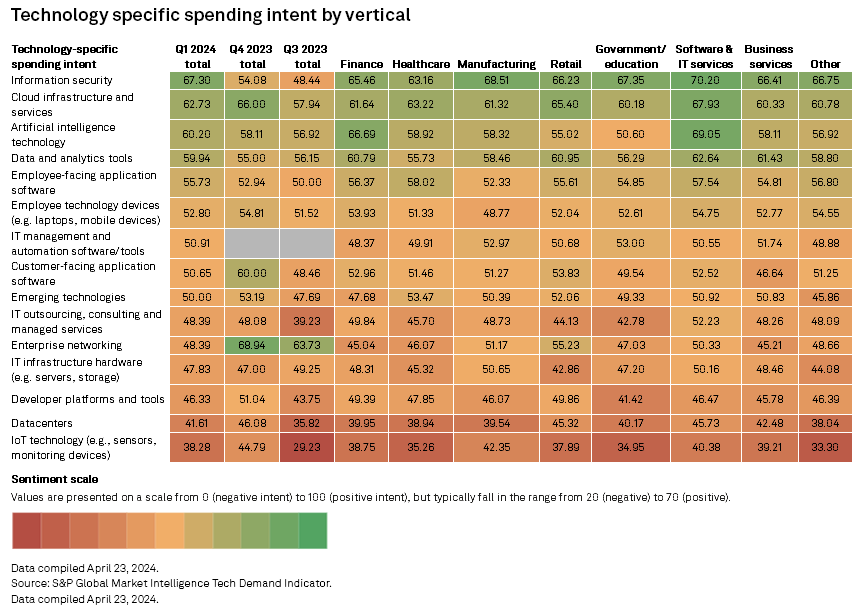
The increase in tech spending can be attributed to three things: artificial intelligence (AI), cloud infrastructure and information security (the last two are related to the first).
And it points to a couple of points worth internalizing as the AI mega trend develops:
- Big Tech revenues will continue to climb as companies across all 11 S&P 500 sectors pump more money into AI and its related technologies.
- It illuminates just how big the AI sector is now … and will be in the future. The global generative AI market was worth $44.9 billion last year and is projected to reach $207 billion by 2030.
This increase in AI spending is already showing in tech stocks. Back in April, I showed you that more than half of the top-performing tech stocks so far this year are tied to AI.
As I mentioned then, I firmly believe the AI mega trend is going to keep growing … and share prices along with it.
Until next time…
Safe trading,

Matt Clark, CMSA®
Chief Research Analyst, Money & Markets