I’ve brought up interest rate cut expectations in a few recent episodes of Moneyball Economics, so today I thought we’d go for a bit of a deep dive to set the record straight…
Here’s why investors are going to be surprised by the Fed’s interest rate policy in 2025.
Click on the image below to watch my video:
Video Transcript:
Hello and welcome to Moneyball Economics. I’m Andrew Zatlin.
I want to cover a lot of ground today, so I’m going to be like Mr. Wolf and Pulp Fiction. I’m going to think fast and I’m going to talk fast.
What I want to do is I want to help you understand why the markets are so crazy right now … and why they’re going to continue to be crazy.
And it all comes down to what’s going on in the economy and how it affects what we think the Fed is going to do with rate cuts.
Because guess what? Consensus keeps misunderstanding and they have to adjust, and when they adjust, it’s like a ship shifting course, a lot of turbulence until things are back online, and that’s what we have today. That’s what we’re going to have tomorrow because I think the markets are going to have another miss.
Let’s talk about what I think is going on in the economy…
Well, ultimately, I’ve been saying for months this has been an economic coil waiting to release, waiting to basically gather traction. The reason I’ve been saying that is my understanding and my read of the data is simple. I’ve been looking at the downturn that started in late spring when hiring started to slow down and so forth.
I’ve been looking at those not as signs of an economically cyclical downturn, but of a temporary external shock driven slowdown. Let me explain the difference.
Economic slowdown is simply a matter of slowing down. Everyone’s got what they need in terms of inventory staff, but an external shock hits, that means it’s temporary, it’s transitory.
In this case, we had TWO issues. First, we had an election. Hey, this election cycle created a lot of anxiety, a lot of uncertainty, so companies more prone to wait it out, right? Not kick off new projects and not hire.
The second issue had to do with the Fed, what I call the Fed F-up.
What the Fed did is in the first half, they kept teasing interest rate cuts. Well, if you’re a company and you’re borrowing, your borrowing costs will go down dramatically when the fed cuts rates. So you are waiting on the sidelines with your money for those rate cuts.
The Fed screwed up and waited too long.
They didn’t cut rates until September, by which point it was too late. Companies start folding up for the year. They’re not going to kick off new projects in the fourth quarter. But both things have passed. They’re both behind us. So going forward, we can expect traction. Problem is consensus doesn’t really understand these things.
I’ve never met any of my peers who’ve worked in the corporate world, so they don’t understand how CEOs, how CFOs, COOs operate, what’s important to them and when they’re going to take action.
So it’s been a big miss and let me show you what I mean by that big miss.
As you know, I follow labor data, I’m “Mr Labor” because my experience in corporate America is that today’s hiring reflects expectations of tomorrow’s business activity. If I expect sales to go up, I’m going to hire accordingly. For example, alright, so my data’s been telling me economic spring, getting ready to uncoil.
Well, last week we started to see signs that I’m right. We had jobless claims collapse, right? Low, low, low signifying strong, strong labor market and then kiss a death for the market and for high-tech stocks, we had Friday payroll. Let me show you what happened on Friday:
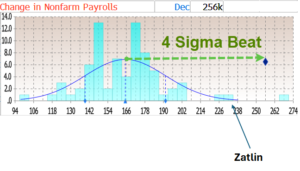
This is a chart which I borrowed from zero hedge and it shows along the bottom the forecast number left to right, going up and down. That’s the number forecasters who forecasted that number on Bloomberg.
So about 80 forecasters.
I’m competing against Citibank, JP Morgan, Goldman Sachs, you name it. All the top dogs out there. As many academics, PhDs and experts as you can imagine.
You know what?
This is the third month in a row where consensus has been incredibly wrong and I’ve been incredibly right.
I’ve beaten the pants off my peers with jobless claims and payrolls for a long time now, and again, it’s because I’ve got better data. I’ve got the experience and I want to give you the edge that I have so you can do better as well.
So here we see in this chart the distribution.
Everyone was hugging about 160,000. The number came out. That black diamond next to that green arrow, that’s what came out. And there I am, my lonely self over there predicting it pretty accurately. At the end of the day, the markets threw up because what we’re seeing is economic strength where they didn’t expect to see it.
It means fewer rate cuts.
The bond market is much bigger than the equity market.
The bond market did not like to see the strength, does not like to see a change in their rate cut expectations. So they’re adjusting there.
I’ve caught you up now let’s look forward what’s coming down the pipeline. More of the same, more volatility, more need to do some straddle plays. If you’ve been following my advice the past couple months and doing straddles, you should have a lot of money in your pocket. I strongly suggest you continue that approach.
This market is not going to be smooth up until the right. I’m going to now show you what’s top of mind for the Fed. What’s going to influence the rate cuts going forward? Because you know what, they like to overcomplicate it and it isn’t.
It all comes down to rate cuts.
What does the Fed expect to see if the economy’s overheating, they’re going to raise or keep rates where they are. The economy’s stalling. They’re going to cut everybody and their mother thought the economy was slowing down. I’ve been saying no, the economy’s picking up.
Guess what? The economy’s picking up going forward.
How does this change the expectations of what the fed’s going to do?
Let me show you two things. Remember, the Fed has a dual mandate. It has to change rates based on what they expect about inflation and based on what they expect about employment. They want to keep employment strong, they want to contain inflation.
I’m going to show you federal fund rates basically past 40 years of what the Fed’s been doing. But I’m going to show you if they want to know if jobs are strong or not, they’re going to look at unemployment data.
Here’s the trick though. Remember, unemployment goes up, the fed wants to cut rates, right? So they move inversely, unemployment’s going up because the economy’s not doing well. The Fed wants to cut rates stimulated and vice versa. Unemployment rates coming down. That means the economy’s doing better, more jobs. Well then the fed’s going to want to raise rates.
Well, I don’t want to show these things moving that way, so I’m going to invert the unemployment numbers so that basically what you’re going to see is unemployment going up, meaning the economy’s not doing well. I’m going to flip that around and say it’s going down.
And so what we should see is the federal fund rate moves down when this inverted unemployment rate comes down when basically unemployment is going up. But I’ve inverted, let me show you what I mean because enough of the words, let me show you the fancy charts going back almost 40 years:
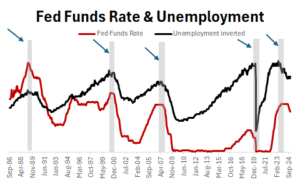
The red line is what the federal, basically what interest rates were. The black line is what was going on with unemployment, again, inverted.
And as you can see, the major inflection points are the same, both in timing and degree, very much the same. To sort of help you see it a little bit better, I put some gray bars there just to indicate this was the peak, right? This is where we had peak interest rates because we also had the lowest unemployment rates and it was all downhill from there.
But notice one thing I really want to call your attention to this. Over here on the right, what we’ve got is a delay for the first time in the previous four cycles, interest rate cuts were late to the party. They should have started a lot sooner back in 2022. Excuse me, yes. Interest rate cuts should have happened back.
You can see visually that there’s a strong correlation here, but let me really stress this by doing the math for you. By doing that high school statistics, if I went back 40 years and I did all this crunching with correlations, and the correlation is not really that strong correlations measured from a degree of minus one to one, where minus one means their correlated in reverse. One means they’re strongly correlated:
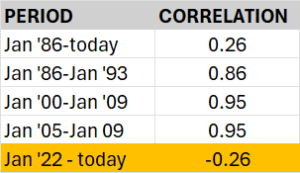
The 0.26 is nothing, right? On a scale of 1.00 to zero weekly correlated.
But if I only focus on those areas where the gray bars are these inflection points on the way up and on the way down, just focus on those five gray bars. This is what you see pretty much almost one-to-one correlation, meaning in terms of timing and degree, federal fund rates follow the unemployment rate religiously.
When we get to these inflection points, look at it from 86 to 93, 7 year period, January ’00 to ‘09, eight year period, same thing, ‘05 and forward until we get to today.
Remember I told you the fed was late to the party. It’s a crappy correlation. So So why don’t I make an adjustment and pull in that rate cut. And if I do that, this is what happen:
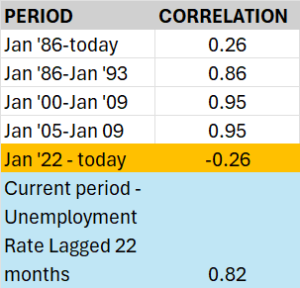
Now, the correlation, if I said the Fed started to cut rates when the unemployment rates started to downshift back in 22, guess what?
Now we’re back on track for that super strong correlation.
Key point here = the Fed is looking at playing catch up. They should have pulled the trigger sooner. A lot of unknowns back in Covid. They should have pulled the trigger sooner.
They’re now playing catch up.
So if I keep that lag, take a look at what happens:
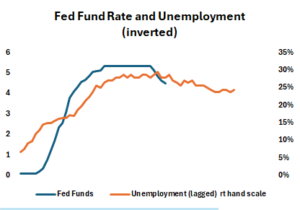
So here we see that same current period. Now I’ve lagged what’s going on with the rate cuts still in black and in orange we’ve got what’s going on with the unemployment rate inverted. So unemployment rate started going down and well, where are we today?
Right now, the fed fund rate, maybe it could come down another 25 basis points. It would line up a lot nicer with that line. However, that’s where we are today. Where are we going to be in the future? Because we’re trying to anticipate for this year how much the fed’s going to cut rates.
Right now, this orange line is saying we are at 4.1% unemployment. Well, what if we really slow down and we go to 5%? In that case, the inverse of one divided by five would bring us down to 20%.
Let me show you what that means on this chart…
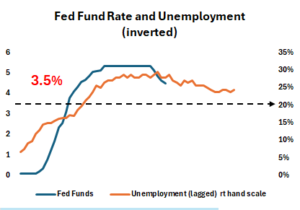
This dotted line going across represents unemployment of 5%.
If we saw unemployment of 5%, which is a big move from where we are today, the Fed would be expected to cut rates 75 to a hundred basis points.
That’s a pretty big drop and a pretty big expectation.
And guess what, that’s where the market’s going to get it wrong.
Right now, the market’s still expecting about a hundred basis points of rate cuts. Maybe 75 Goldman’s out there at the extreme saying only three rate cuts.
Well, guess what, folks?
We might only get two, three is probably the limit.
The market’s not expecting that.
So again, as we see this, good news of a strong economy, expect the market to puke, they don’t want a strong economy.
They want rate cuts. They’re not going to get ’em.
So at some point in time though, they’re going to love the P PDE values. They’re going to love all this profit that’s being thrown out and we want to be there buying these huge dips and getting ready.
Alright, we’re ready to win it and we’re going to. Zatlin out.

Andrew Zatlin
Editor, Superforecast Trader


