Books on technical analysis tend to define an uptrend as a series of higher highs and higher lows.
This chart pattern indicates prices are moving higher on each leg up and selling is easing earlier in the legs down.
Uptrends as a Recession Indicator
It’s a useful definition that you can apply to any data set.
Today’s chart shows the difference between low-grade corporate bonds and Treasury notes.
Low-grade corporates are bonds rated Baa by Moody’s.
This is just one notch above a junk-bond rating (Bbb and below). Moody’s explains that bonds rated Baa have a moderate amount of risk: They are considered medium-grade and speculative to some degree.
Most of the time, Baa bonds deliver their interest payments to investors.
But they could struggle to pay interest during an economic downturn.
Recession Indicator: Risky Baa Bonds
Because yields on bonds change as economic conditions evolve, the difference (aka the spread) between risky Baa bonds and safe Treasury bonds varies over time.
That spread is rising right now.
Rise in Spread = Increased Risk for Baa Bonds
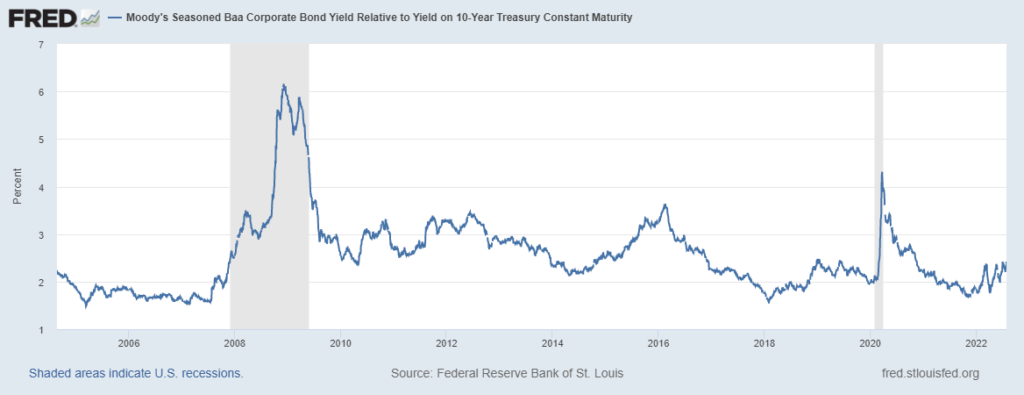
Source: Federal Reserve.
The spread rises as risk increases.
During economic expansions, investors buy Baa bonds for income.
They consider them safe in a strong economy, so they are willing to pay more.
As they buy the bonds, they push the yields down, moving them closer to those available on a 10-year Treasury.
As the economy weakens, the process reverses.
Keep an Eye on Baa Bonds
Traders sell risky assets and move into safe Treasurys.
This forces the spread to widen as it is now.
The spread is now at a two-year high. In the past, a two-year high has preceded a recession.
There have also been false signals where no recession occurred.
But stock market weakness almost always follows a two-year high in the spread.
Bottom line: This is another warning that the bear market in stocks might not be over.
Click here to join True Options Masters.