Now that the dreaded inverted yield curve, a key recession indicator, has finally arrived, when can investors expect the stock market to come tumbling down?
As history shows, not any time soon.
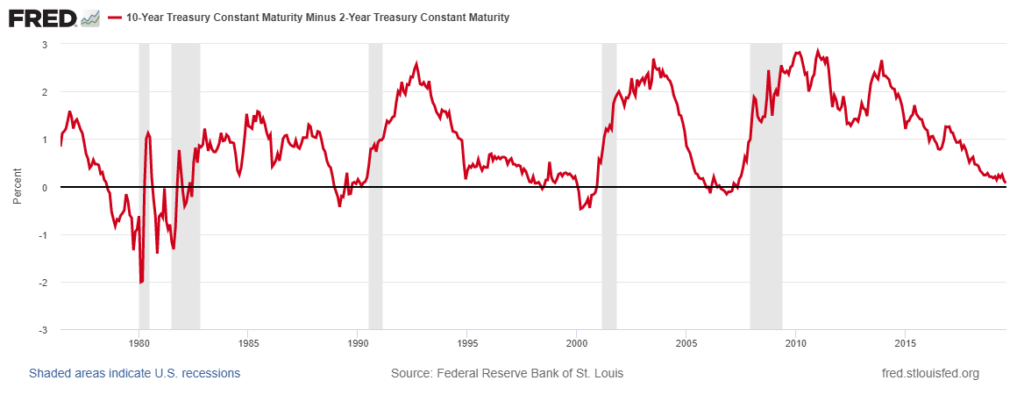
Early on Wednesday morning the yield on the 10-year Treasury note dipped below the yield on the 2-year note, but the stock market could experience a rally for up to 18 months before signs of trouble become apparent, according to historical analysis from Credit Suisse. However, looking at the past 10 inversions, the S&P 500 peaked within about three months of the inversion 60% of the time (1956, 1959, 1965, 1973, 1980 and 2000), per ZeroHedge.
Research on yield curves is fairly young, with strategists publishing data on the effects of inversions for the first time last summer, according to CNBC. Short-term rates at that time rose, causing the yield on the 3-month note to invert with the 10-year, but stocks continued to set new records.
This is the big one, though.
An inversion of the 2-year/10-year yield has been the main event strategists having been tracking because it reliably happened before every recession of the last 50 years, even if the effects were not immediately apparent.
“While an inversion has preceded each recession over the past 50 years, the lead time is extremely inconsistent,” Jonathan Golub, chief U.S. equity strategist at Credit Suisse, wrote in a study from July 2018. “Historically, an inverted yield curve has been accompanied by a variety of other ominous economic signals including layoffs and credit deterioration.”
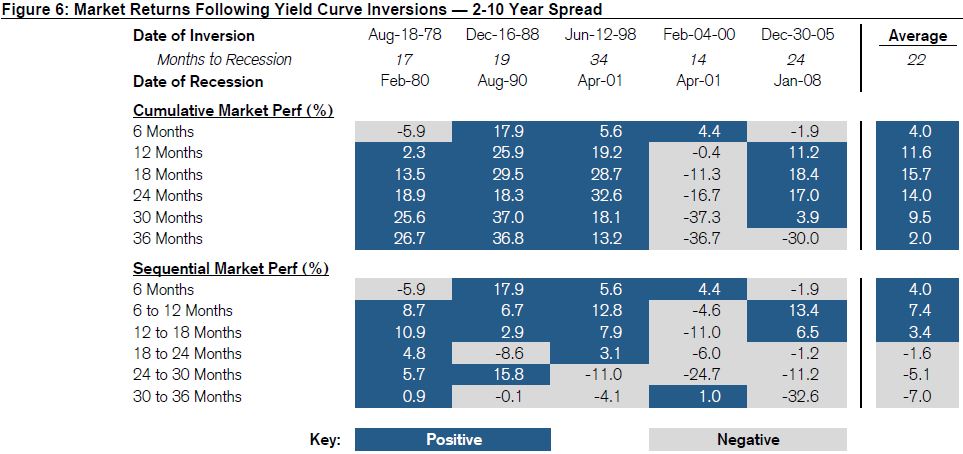
The Credit Suisse data shows that stocks will rally more that 15% on average for the 18 months following an inversion of the 2-10 yield curve, but then it’s bad news from there.
The financial crisis on Dec. 30, 2005, is a perfect example of this phenomenon, when the 2-year/10-year yield inverted about 18 months beforehand, and stocks generated a cumulative gain of 18.4% before returning intensified losses for one-and-a-half years after the crisis hit.
Bank of America Merrill Lynch joined the warning call on Monday as well, saying the “S&P 500 (is) on borrowed time if the 2s10s yield curve inverts,” according to CNBC.
“The BofAML U.S. Economics team suggests that recession risks are rising. The 3-month T-Bill vs the 10-year T-Note curve has already inverted and the risk is that the 2s10s curve inverts as well,” Stephen Suttmeier, Bank of America technical strategist, wrote in a note. “Sometimes the S&P 500 peaks within two to three months of a 2s10s inversion but it can take one to two years for an S&P 500 peak after an inversion.”
The Bank of America analysis shows the average length of time between the yield curve inversion and a recession’s start is 15.1 months.
“The typical pattern is the yield curve inverts, the S&P 500 tops sometime after the curve inverts (see above) and the US economy goes into recession six to seven months after the S&P 500 peaks,” Suttmeier said. “After the initial drawdown, the S&P 500 can have a meaningful last gasp rally.”