
Because of its importance to the markets, it’s important to answer questions like what is the yield curve is and how does it work.
It’s used to gauge things like future interest rates set by the U.S. Federal Reserve, overpriced securities and the trade-off between maturity and yield.
But understanding what the yield curve is may be a little more complex.
Markets, economists and analysts also use the yield curve as a prediction tool to determine when or if a recession is coming.
We’ll start by discussing what the yield curve is, the different types of yield curves, factors that influence the yield curve and, finally, different yield curve theories.
What Is the Yield Curve?
To put it simply, the yield curve is determined by plotting the interest rates of the different Treasury bonds.
It compares the yields of the most common Treasurys — three-month, two-year, five-year, 10-year and the 30-year (Treasury Secretary Steven Mnuchin also indicated recently he’s “seriously considering” a 50-year bond).
The Treasury Department will post the yield curve rates each trading day, typically after the markets close and by 6 p.m. EST.
Traditionally, the yield curve is displayed on a line chart with the X-axis representing the interest rate and the Y-axis representing the maturity date.
As you can see, the most common shape of the yield curve is upward — meaning the lower-term debt has lower interest rates than longer-term debt.
But there are several different types of yield curve shapes.
We have looked at what the yield curve is. Now let’s examine what it means.
Curve Shapes Help Pace Future
There are three main shapes to the yield curve that analysts look at: normal, flat and inverted.
However, there are two others — steep and humped — that we’ll look at.
Normal: The most common yield curve is normal, or upward. It indicates lower-term Treasurys like three-month and 2-year debt has a lower interest rate than 10-year and 30-year debt.
It makes sense because if you are loaning out money for a longer-term, you expect to earn more interest on that debt. During times of a normal yield curve, there is the expectation of a decline in inflation.
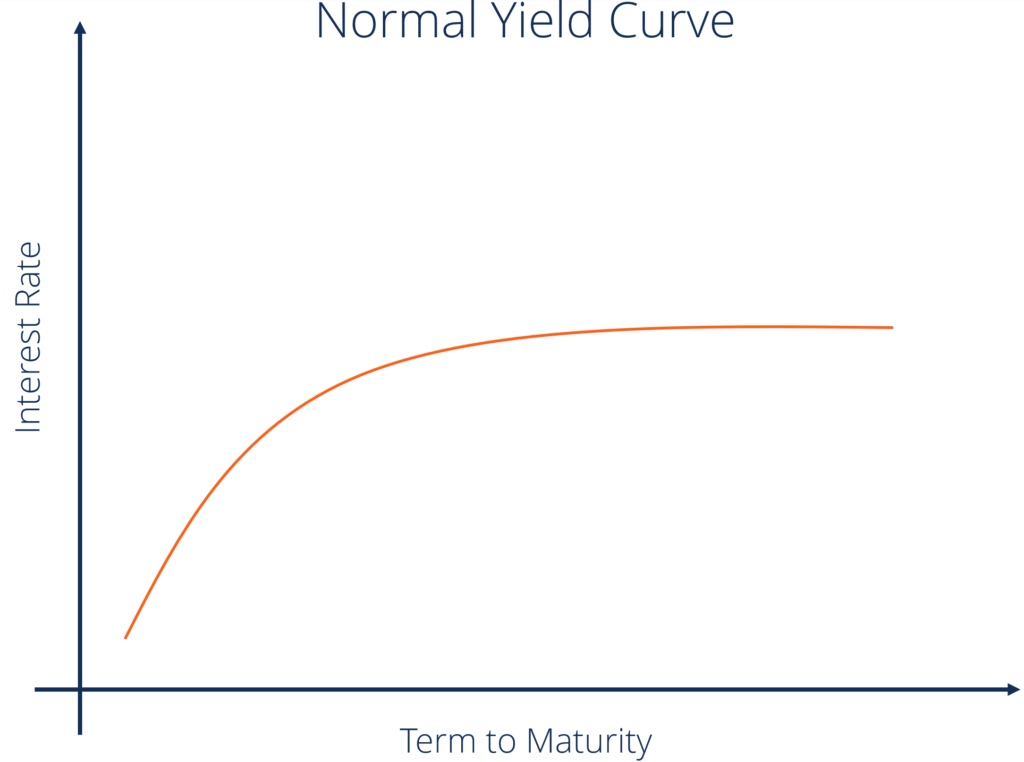
Courtesy of the Corporate Finance Institute.
When yields make this curve the economy is typically in an expansion mode, according to the Corporate Finance Institute. But investors should exercise caution as the longer the curve remains normal, the greater the probability it will change.
Inverted: Just as it would suggest, the inverted yield curve means the opposite to the normal. In this situation, lower-term Treasury debt has a higher interest rate than longer-term debt.
In instances when the curve becomes inverted, long-term investors are thinking yields will decline in the future. An inverted yield curve typically indicates a weaker economy.
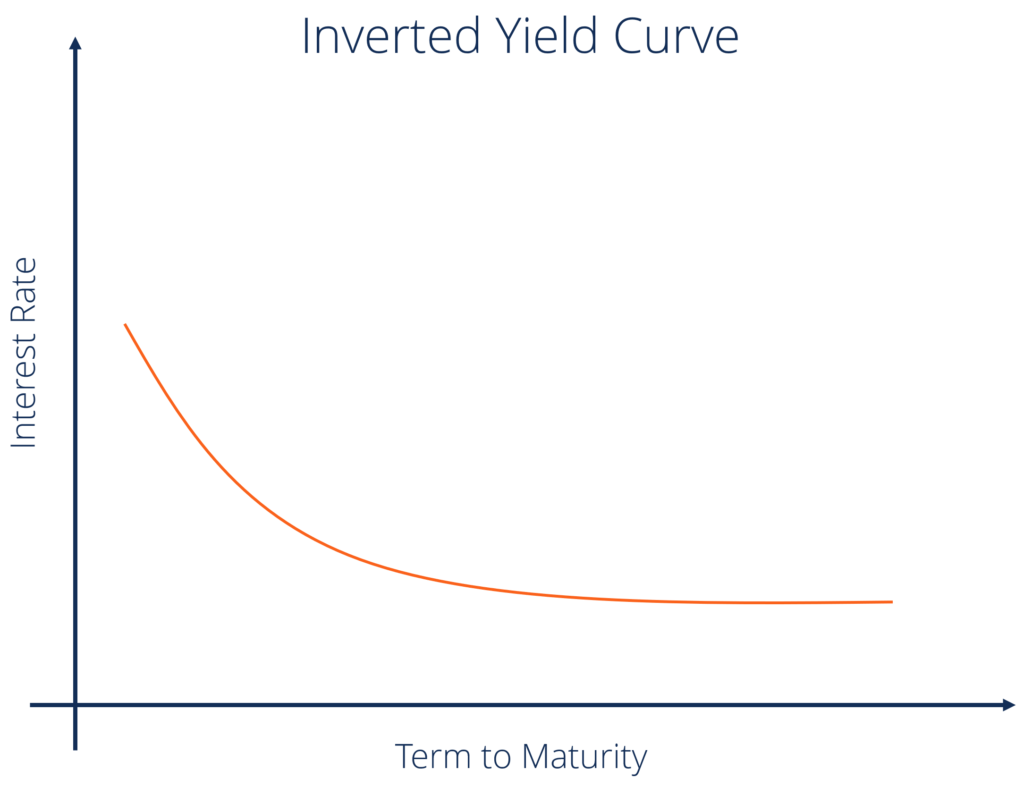
Courtesy of the Corporate Finance Institute.
Investors buy up longer-maturity bonds because of the high yields during a normal curve. When that happens, the lack of demand for short-term securities drives the price down, but the yields up — hence, inverting the curve.
The inverted yield curve also suggests the possibility of an economic downturn on the horizon. In fact, the yield curve inversion has accurately predicted each of the last five recessions, going back to 1980.
Historically, the downturn occurs about two years after the yield curve inverts.
Flat: This yield curve — or lack thereof, will occur when the market is transitioning from one end (normal) of the yield curve spectrum to the other (inverted) — or vice-versa.
The yield of a 10-year bond is basically the same as that of a 30-year bond.
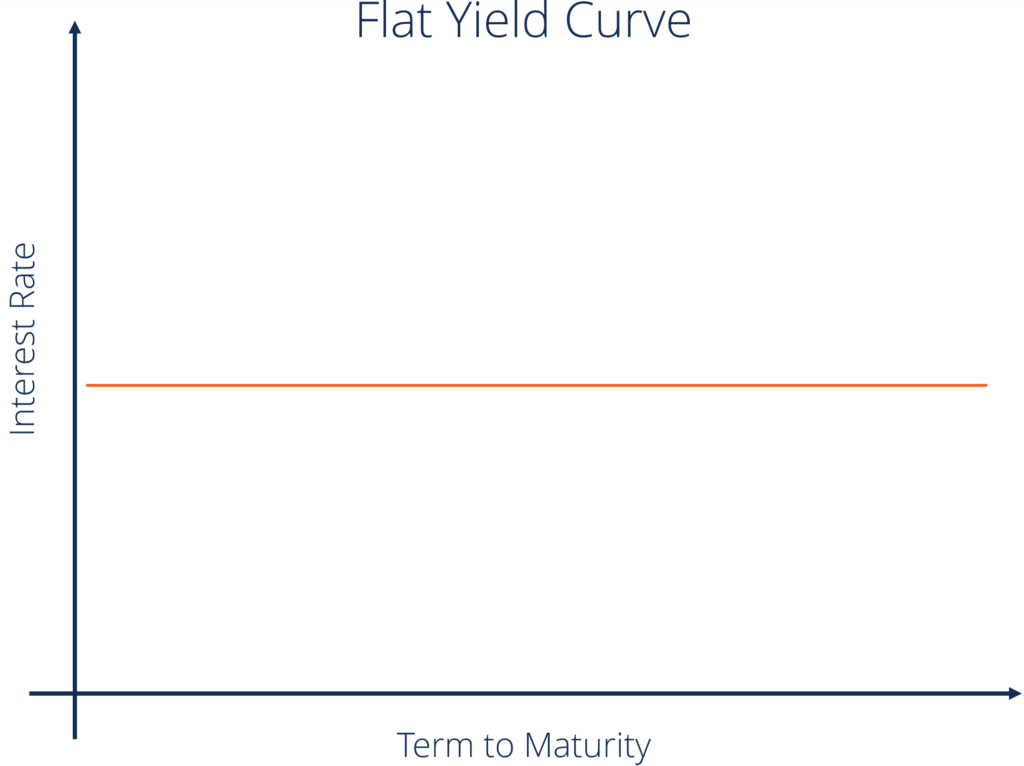
Courtesy of the Corporate Finance Institute.
Steep: There have been instances where long-term yields rise at a more rapid pace than short-term yields.
This creates a steep yield curve.
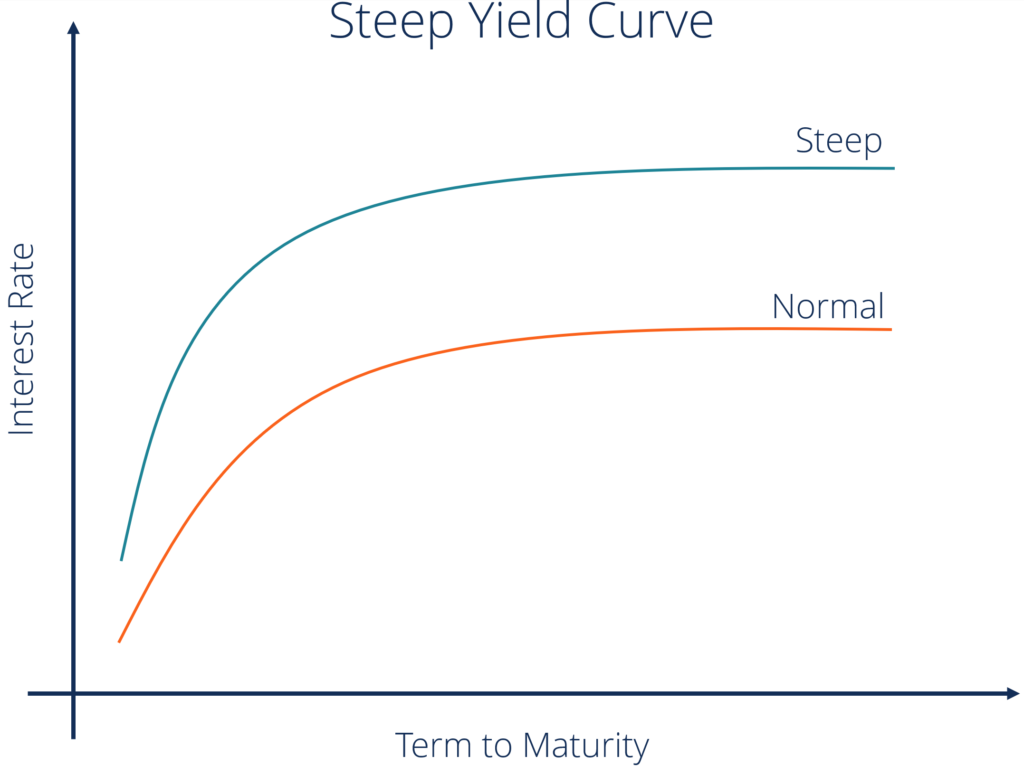
Courtesy of the Corporate Finance Institute.
Market conditions are basically the same for the steep yield curve as they are for the normal. The exception is the steep curve indicates a wider gap between short- and long-term yield expectations.
Typically, a steep yield curve indicates quick economic expansion is on the horizon.
Humped: Perhaps the rarest of yield curves is the humped yield curve.
This basically occurs when mid-term yields are higher than both short-term and long-term ones.
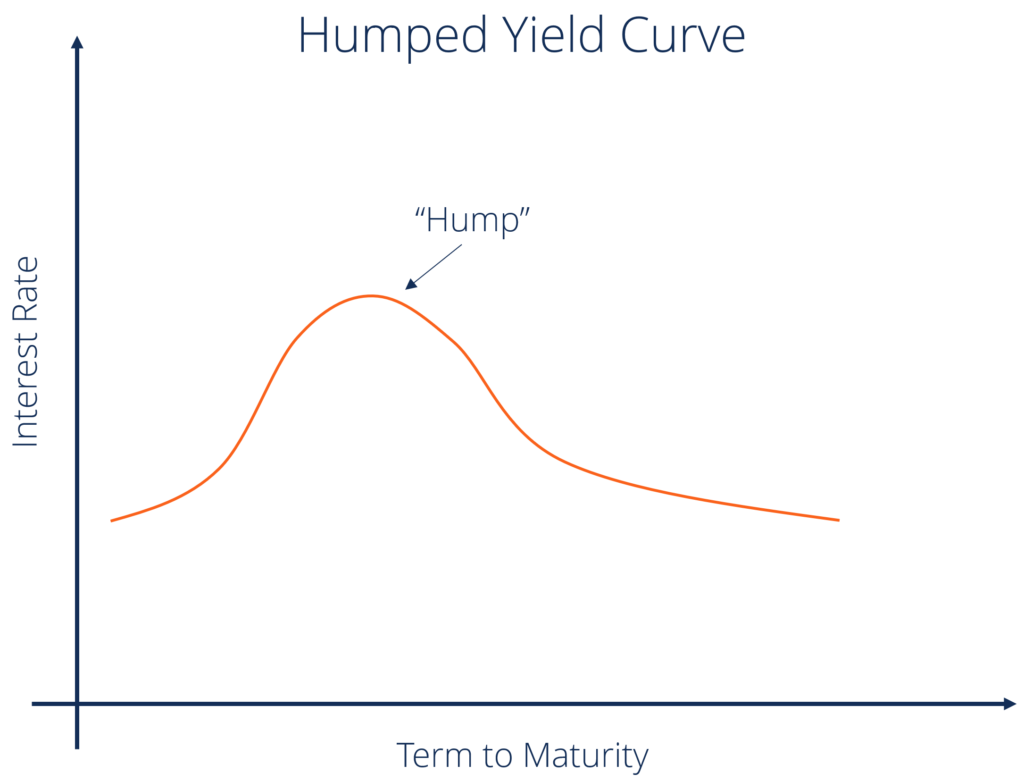
Courtesy of the Corporate Finance Institute.
When yields are in a humped curve, the expectation is for an economic growth slowdown. But again, the humped yield curve is rare. It can indicate potential market volatility due to a change in economic policies.
Factors Of the Yield Curve
According to the Corporate Finance Institute, there are three different influencing factors to the yield curve:
- Inflation — If the Federal Reserve anticipates inflation will go up, they will increase interest rates to correspond. If inflation goes up, purchasing power for investors goes down and the short-term interest rate will go up.
- Economic growth — If the economy is strong, or heading that way, inflation could increase because of stronger demand. A strong economy also means competition for capital — more options to invest for investors. Strong economic growth tends to lead to larger yields and a steeper curve.
- Interest rates — At times, the Federal Reserve will raise interest rates on Treasurys. When that happens, there is a higher demand for those Treasurys because of the increase in return. However, the stronger demand also then leads to a decrease in interest rates.
What Is the Yield Curve Used For?
There are several different uses of the yield curve. Investors can pick and choose what they think different iterations of the curve mean now and for the future.
One thing investors use the yield curve for is to forecast interest rates.
During instances when the curve is sloping up, investors would be more prone to move money out of bonds and long-term securities because of the volatility.
When the curve slopes down, there may be declines in interest rates and bond prices could move upward.
Commercial banks can use the yield curve to determine when to borrow most of their funds. If the yield curve is on the way up, banks can borrow most of their funds by selling short-term deposits and lending those funds long-term.
Banks can earn more profit when the curve slopes upward — and, the steeper the better. The steeper slope means the distance between borrowing and lending rates is wide, meaning higher potential profits.
The yield curve can also be used as a determinant of overpriced or underpriced securities. For example, if a security has a rate of return higher than the yield curve, it could indicate the security is underpriced — meaning it could be a good time to buy.
Conversely, if the security’s rate of return is lower than the yield curve, it could signal the security is overpriced and time for an investor to sell.
So as you can see, there are many different types of yield curves and those types have different meanings. Also, how investors use the yield curve varies as well.
Because they are used to predict market conditions, it’s important to know what the yield curve is and how does it work.
Related:
Godfather of the Inverted Yield Curve: We Are in Recession ‘Code Red’
Cramer: The Link Between This Yield Curve and a Recession Is Wrong
Key Yield Curve Inverts Again, 30-Year Rate Paying Less Than Stock Dividends
Recession Watch: Critical Yield Curve Inverted Multiple Times Again Friday
Yield Curve Inverts Again After Fed Presidents Waver on Rate Cut
Fed’s Bullard: Only a ‘Sustained’ Yield Curve Inversion Is Cause for Alarm
Economy Flashes More Warning Signs as Treasurys Sink to ‘Historic’ Lows
Trump Slams Fed for ‘CRAZY INVERTED YIELD CURVE!’
Yellen, Cramer Say Yield Curve Inversion Could be False Recession Signal This Time
How Long Until a Recession Hits After the Big Yield Curve Inversion?