As the Federal Reserve raises interest rates, one thing seems certain: A recession is near.
The Fed doesn’t intend to cause a recession. And officials will do everything possible to avoid it.
But history shows higher rates almost always end in recession.
The chart below shows the federal funds rate and the short-term interest rate the Fed controls. Gray bars highlight recessions. Every time the Fed raised rates, a recession occurred later.
Fed’s Fund Rate Hikes: A Recession Indicator
Rate Hike Pattern Points to Recession
The pattern isn’t random.
Higher rates make loans less attractive to consumers and businesses. If consumers don’t borrow money, many can’t afford big-ticket items, like new cars or home appliances. If businesses don’t borrow money, many can’t afford to expand.
Without consumer demand, businesses are less inclined to expand. Higher rates make new projects for businesses less attractive.
Business expansion creates jobs. Without this borrowing, the number of jobs shrinks and contributes to a recession.
Recessions are one reason investors don’t like rate hikes.
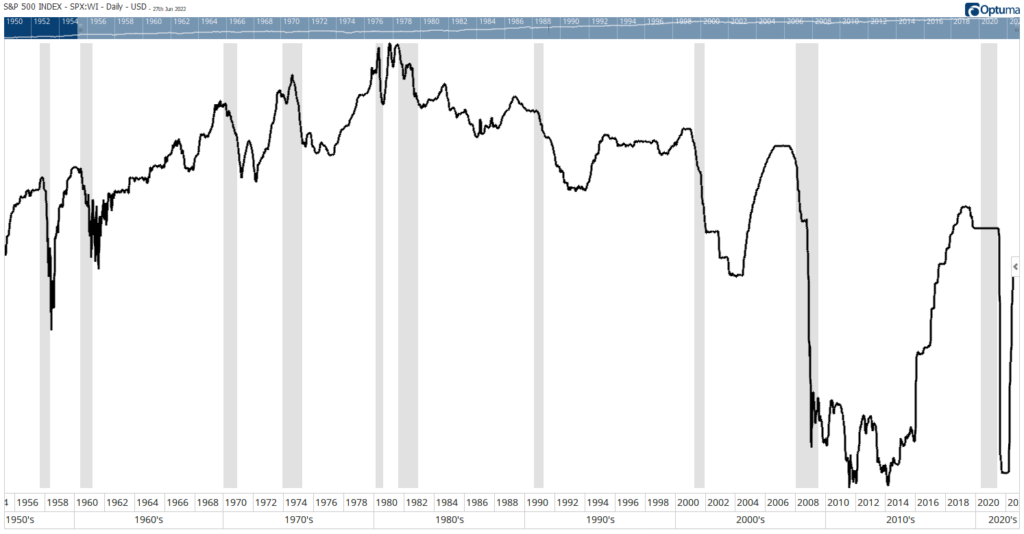
Recession-Related Bear Markets
The chart shows the Fed’s rate hikes data since 1955. There have been 11 bear markets over that time — not counting the current one.
Recessions coincided with eight of those bear markets.
On average, bear markets during recessions lost 36.5%. The three bears that occurred outside a recession lost an average of just 27.9%. The steepest decline not associated with a recession was 33.5%.
Five of the eight recession bears were worse than that.
Recession-related bear markets last longer. They took an average of 432 calendar days to reach a bottom. That is more than twice as long as the 179-day average of non-recession bears.
Bottom line: If we are heading toward a recession, we are less than halfway into the bear market. That’s not good news for investors, but it’s news they need to know.
In bull markets, buy-and-hold investors fare well. In a bear market, short-term trading can offer profits while long-term investors watch losses mount.
And if you’re looking for a short-term strategy, you can depend on my Greed Gauge to churn out profitable opportunities.
How? It accurately measures the precise level of investor greed — in real time — for every single stock in the S&P 500.
Greed is a powerful emotion that permeates through all capital markets. And with lower stock prices, investors are going to look for chances to “get greedy.”
Thorough back testing shows that my Greed Gauge would have made you money in seven of the last nine market downturns.
My system also found winning trades, including 88% … 226% … and even 775%, in 31 days or less.
To see how simple this new system is, click here to watch my “Greed Gauge Revealed” presentation now.
Michael Carr is the editor of True Options Masters, One Trade, Precision Profits and Market Leaders. He teaches technical analysis and quantitative technical analysis at the New York Institute of Finance. Follow him on Twitter @MichaelCarrGuru.