After watching interest rates rise, a lot, off the coronacrash bottom, folks wonder: “What happens if they keep rising?”
But I think: “What if they start to fall again?”
See, my technical analysis of the 10-year Treasury rates suggests the recent climb has gone too far, too fast … and that rates are more likely to pull back in the coming months.
Have a look at the chart…
10-Year Treasury Rate: Bearish Divergence
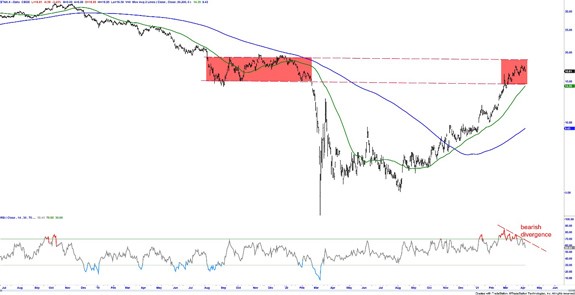
For one, the 10-year rate has far exceeded both its 50-day and 200-day moving averages. It’s “stretched,” we say.
What’s more, a bearish divergence is forming. By this, I mean that the rate has, since the end of February, continued to make higher highs, but its momentum metrics have instead begun trending lower.
These divergences typically result in price (read here: the interest rate) falling lower on a lag to its momentum.
Finally, I marked the level between 1.5% and 1.9% in the chart with red dotted lines. This is a zone of resistance for the 10-year rate. If rates got above this level, it would likely take more than a single attempt to mount a breakout.
All told, I wouldn’t be surprised to see the 10-year rate fall back down to 1.2% in the coming months.
How Interest Rates Affect Utilities Stocks
Utilities stocks typically do best in falling rate environments for two reasons:
- Their cost of capital becomes cheaper, which, in turn, makes capital expenditures more affordable — allowing for larger profit margins.
- Perhaps more importantly, from the vantage point of the yield-seeking investor, utilities stocks are often viewed as “bond substitutes.” And when the yield on bonds moves lower, the dividend yield that utilities stocks pay becomes increasingly attractive.
Here’s a chart of the yields paid by the major U.S. stock sector ETFs as well as the iShares 7-10 year Treasury Bond ETF (Nasdaq: IEF):
Sector ETF Yields Compared to 7-10 Treasury Bonds
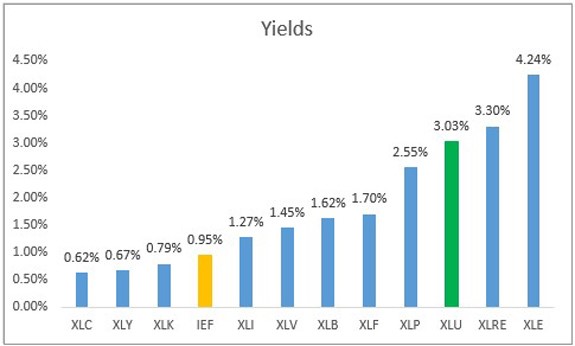
As you can see, the Utilities Select Sector SPDR Fund (NYSE: XLU) pays a yield three times greater than the iShares 7-10 year Treasury Bond ETF (Nasdaq: IEF).
For a yield-seeking investor, XLU is a better option today. That advantage will grow if bond rates pull back over the next several months.
I’m always tracking 11 sectors of the market for my Home Run Profits and Green Zone Fortunes subscribers. It’s what helps me reveal trends like the one above. I even lay out what sectors are in uptrends (and downtrends) each week on my Leaders & Laggards board. It’s just one of many tools subscribers can access to help find more safe and potentially profitable investments.
To find out how to gain access to these tools and receive Charles Sizemore and I’s highest-convictions monthly research and stock ticker recommendations, check out the details on my Millionaire Master Class here.
To good profits,

Adam O’Dell
Adam O’Dell is the chief investment strategist of Money & Markets and has held the title of Chartered Market Technician for nearly a decade. He is the editor of Green Zone Fortunes, the trend and momentum options-trading powerhouse Home Run Profits and the time-tested switch system 10X Profits.