“Sell in May and go away” is a popular Wall Street adage.
Conventional wisdom says we should sell stocks in May because it’s the start of the worst six months in the stock market. So, selling avoids the risks that, according to history, occur during that time.
It’s an old saying, dating back to the London Stock Exchange in the 1700s. But it withstands the test of time.
Over the past 50 years, selling in May allowed investors to attain more than 90% of the gains of the S&P 500 while being invested just half the year. This year, the index delivered a big gain in the first half of the worst six months. It’s up more than 16% since May 1.
But a deeper look at the strategy shows the worst time to own stocks might be the six weeks beginning in mid-August.
The chart below shows the S&P 500 Index as the black line. The blue line is the seasonal trend of the index. The peak in the seasonal trend occurred this week.
The S&P 500’s Seasonal Peak
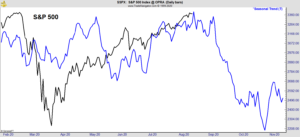
This seasonal trend uses the same technique used to define the worst six months. The only difference is that the math uses daily data instead of monthly prices.
Seasonal Trend: Sell Stocks in August
For seasonal trends, the direction of the trend is more important than the value of the indicator. In the past six months, the price action closely followed the seasonal trend. And now that trend turns sharply negative.
The blue line in the chart above was calculated a year ago. At that time, there was no way to know a pandemic would devastate the economy. There was no way to know that stocks would be grossly overvalued by fundamental metrics. All we knew was that history said a peak was due in the middle of August.
Despite all the uncertainty of 2020, the seasonal trend has been useful. It marked several important turning points on the index.
Investors rarely use seasonal strategies, but they can be profitable. That’s why I use time as one component of my “Strike Zone” indicator.
Find out how you can use my “Strike Zone” Indicator to see gains of 364% in 12 days, 323% in 18 days, 496% in 4 days and more today. Sign up for this FREE broadcast.
Michael Carr is a Chartered Market Technician for Banyan Hill Publishing and the Editor of One Trade, Peak Velocity Trader and Precision Profits. He teaches technical analysis and quantitative technical analysis at New York Institute of Finance. Mr. Carr is also the former editor of the CMT Association newsletter, Technically Speaking.
Follow him on Twitter @MichaelCarrGuru.