
“Sell in May and go away” is a popular bit of Wall Street wisdom. It’s often said that May begins the worst six months in the stock market, which justifies the idea of selling to avoid that time period altogether.
The saying is grounded in history — but it’s the history of London’s sewage system rather than the stock market.
This advice seemed to originate in the 1700s when the Thames River was London’s lifeline. Goods flowed in and out of the city along the river, making urban life possible. Population growth also increased the amount of waste flowing into the river.
Historians describe the problem in detail, but one fact makes it easy to understand. An unusually hot summer in 1858 became known as the “Great Stink” as the river’s problems forced Parliament to shut down. Even before this exceptionally pungent summer, anyone who could afford to, left the city for the countryside.
Among those with the means to leave were the city’s stockbrokers, who liked to say, “sell in May and go away, do not return until St. Leger’s Day.”
St. Leger’s feast day on the church calendar is Oct. 2.
Sell in May and Go Away?
 Given that history, it’s reasonable to ask if “sell in May” makes sense. The charts below suggest that it depends. The charts show different relative returns and the win rates for different six-month holding periods.
The first chart shows results since 1900 to include the largest amount of data possible. Results are inconclusive.
The chart in the middle uses data since 1933. That’s when the 20th Amendment to the Constitution moved the president’s inauguration from March to January. Strong seasonal trends in the stock market are tied to presidential elections and data before 1933 shows different patterns.
Since 1933, the six months beginning on May 1 do have the least attractive returns.
On the right, the chart tracks six-month holding periods since 1989. This is when index ETFs began trading and index funds became widely available. These instruments changed how individuals and institutions invest, and how the stock market has behaved differently since then.
Green highlights the best month in each category while red is used to show the worst period by a specific measure. Six-month holding periods starting in May have underperformed on at least one measure in all time periods.
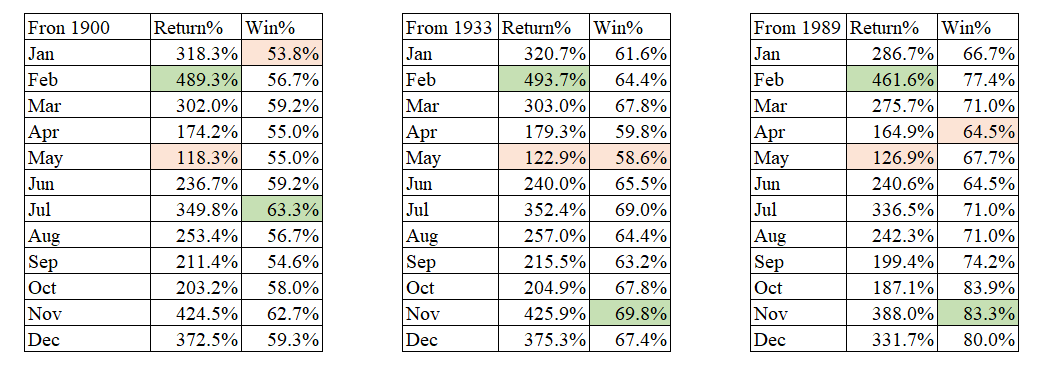
This isn’t definitive proof that you should sell in May. But it is interesting.
Even though there is nothing about the Thames River’s smell to explain the reason why stocks have underperformed since 1933, the data does suggest investors should be cautious at this time of year.
• Michael Carr is a Chartered Market Technician for Banyan Hill Publishing and the Editor of One Trade, Peak Velocity Trader and Precision Profits. He teaches technical analysis and quantitative technical analysis at New York Institute of Finance. Mr. Carr also is the former editor of the CMT Association newsletter Technically Speaking.
Follow him on Twitter @MichaelCarrGuru