
In finance, as in life, the numbers don’t lie and those numbers suggest the S&P 500 is overvalued — by a lot.
Strategist Ned Davis says that overvaluation means either earnings have to increase by a lot or equity prices have to drop to revert the market back to fair values.
S&P 500 Overvalue Starts at PE Ratio
Using the price-to-earnings metric — which measures a company’s current share price relative to its per-share earnings — shows the S&P 500 is trading 24.37 times forward earnings.
To put that in perspective, the average ratio in the last five years was 16.7, and just under 15 in the last decade.
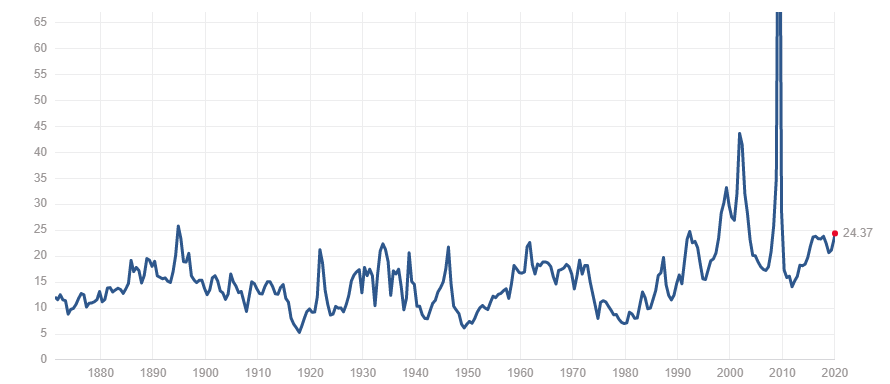
This chart from multpl.com shows the history of the PE ratio for the benchmark market. There was a massive upswing in the ratio during the recession of 2008 and 2009 followed by a big dropoff.
Now we can see the PE ratio starts to tick back up to levels it hasn’t seen since the early 2000s.
S&P 500 Overvalue Rolls On With PS Ratio
But there’s another factor to look at when considering how the S&P 500 is massively overvalued: the price-to-sales ratio.
The price-to-sales ratio looks at a company’s market capitalization and divides it by the company’s revenue in the last 12 months. A lower P/S ratio usually leads to a stronger investment.
And this is where the overvalued picture really begins to get clear.
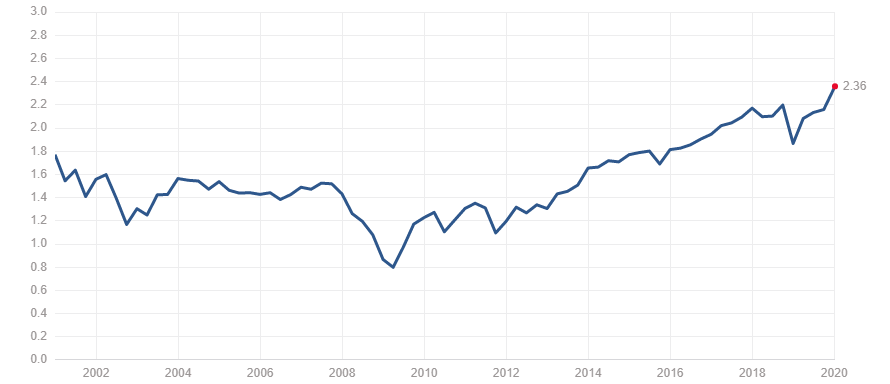
As you can see, the PS ratio of the S&P 500 is at 2.36, even higher than its previous high in September 2018 and way higher than recession levels in 2008 and 2009.
Davis, the senior investment strategist at Ned Davis Research, told Axios that even though Wall Street analysts predict modest equity growth in 2020, “the long history of valuations tells me that over long-periods, prices tend to revert to or below fair values.”
In short, Davis sees market prices falling.
Davis added the S&P 500 “could be overstating earnings due to buybacks and other financial engineering of profits.” Over the last five years, S&P 500 earnings have topped corporate profits.
“P/E ratios are some 80% above the long-term norm,” Davis said.
Interest Rates Tell the Same Story
One factor not thrown into the mix is the impact on interest rates.
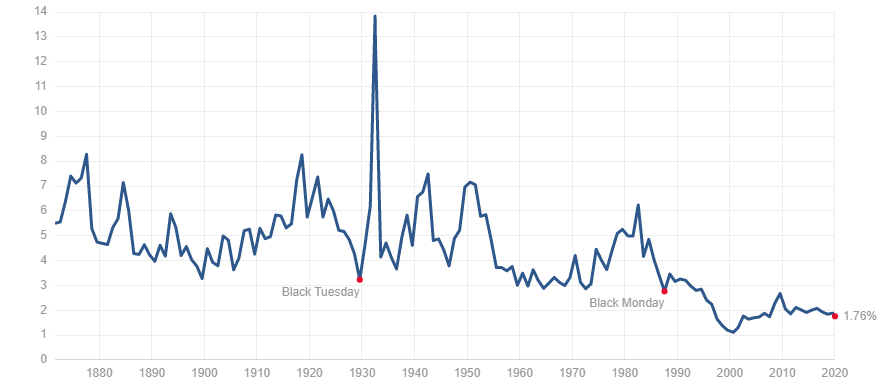
As you can see in this chart, the S&P 500 dividend yield is 1.76% — lower than the current 10-year U.S. Treasury yield of 1.88%
It’s also well below the 30-year Treasury yield of 2.37%.
In August 2019, that trend was reversed and we saw one of the strongest market years in a long time.
Does it mean we are headed for a market correction? That’s hard to say, but you can’t ignore the fact that numbers suggest the S&P 500 is overvalued.
Davis said “the trend is up and the Fed is friendly,” but he also added of the current overvalue situation: “This is a real concern.”