The S&P 500 is at a crossroads.
“A break above 2,950 is a buy signal and a move to 3,400 (+15% from now) is likely if that happens. A break below 2,675 is bearish and sets up a target of 1,675 (-38% from now).”
Market volatility has been the rule lately as indexes swing up and down on headlines amid the novel coronavirus pandemic, and once the S&P 500 trend is set we should have a good idea of what the future holds.
Some are projecting more pain for the S&P 500 in the near-term.
“It does appear like this rally that started on March 23 is really starting to lose steam,” Newton Advisors President Mark Newton said in a recent interview on CNBC. “I’m not certain that we have to necessarily retest the lows right away, but a lot of this does have to do with Treasury yields breaking down, very similar to what happened in mid-February and also in mid-January, which coincided with stocks also starting to turn lower.”
The Real S&P 500 Trend Will Soon Reveal Itself
But Banyan Hill Editor and Chartered Market Technician Michael Carr is watching for the real S&P 500 trend to reveal itself really soon — up or down.
“Now is a time to let the market tell us what to do,” said Carr, editor of
Carr calls it “one of those rare times when we know exactly where we are in a pattern.” And waiting for the S&P 500 trend to either “breakout or breakdown is the best way to minimize risk.”
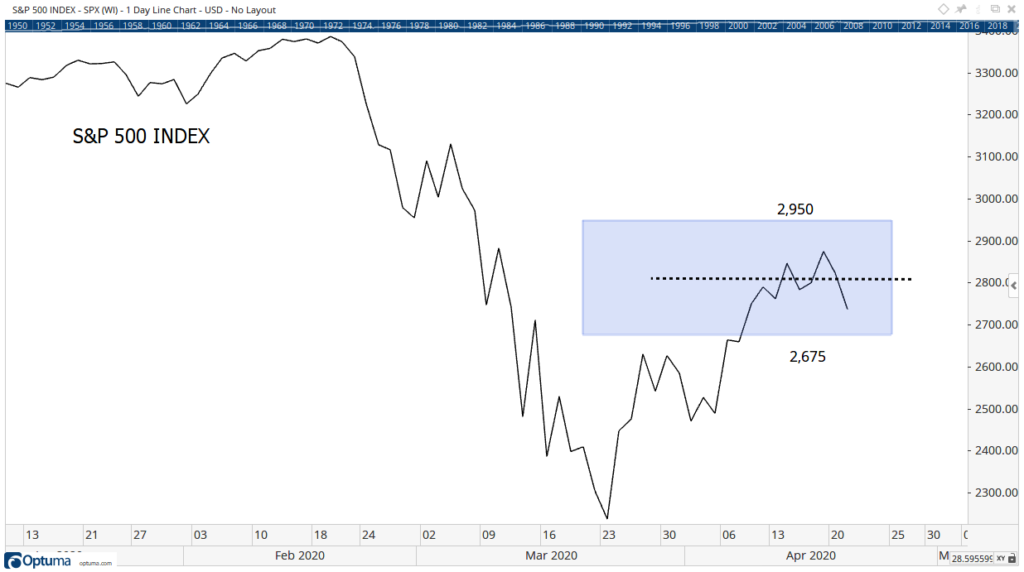
“We know there was a big decline. Since the late 1800s, we’ve known that prices retrace part of a large move. Charles Dow, the founder of The Wall Street Journal, explained that prices retrace about a third to two-thirds of a big move. The chart of the S&P 500 index above shows those levels highlighted by a blue box. The dash line represents a 50% retracement,” Carr explained.
The S&P 500 trend lately has led to gains of over 20% since hitting a low on March 23 amid the COVID-19 selloff. The index, which closed at 2,799 points Wednesday, is still well off its record-high close of 3,386 on Feb. 19.
Carr argues the recent surge makes a lot of sense as people buy the dip in hopes of a recovery.
“A retracement is normal because the decline made prices attractive to value hunters. Their buying pushed prices up, retracing part of the decline. In recent action, the index retraced half of its losses and the buying paused,” Carr said. “That’s normal because large funds watch these levels closely. They know we are at important level and they know a high-probability set up is developing.”
Carr says to watch for the S&P 500 to trend toward certain levels that could trigger massive buy-ins or selloffs by large funds.
“Right now, many large funds are waiting for the market to show its true trend. Prices will breakout of the range highlighted above,” Carr said. “A break above 2,950 is a buy signal and a move to 3,400 (+15% from now) is likely if that happens. A break below 2,675 is bearish and sets up a target of 1,675 (-38% from now).”
So while the S&P 500 trend is currently of hovering between these two levels, Carr thinks it’s best to wait before making any big moves.
“There’s a lot of risk in the current market,” Carr said, “and waiting for a decisive signal is the best course of action.”