This is a strong trading edge and using call options could multiply the gain significantly.
In the long run, the stock market outlook is bearish. But in the short run, a breadth indicator is telling us that a rapid run-up is likely.
Market breadth indicators measure how many stocks are part of a trend.
Breadth Indicator: Moving Averages
The breadth indicator in the chart below is the percentage of stocks in the S&P 500 above their 50-day moving average (MA).
There are many ways to measure the direction of a stock’s trend. The simplest compares the price to an MA. If the price is above the MA, the trend is up.
Analysts use several MAs with this technique. One of the most popular is the 50-day MA, which defines the short-term trend.
For the indicator below, each stock trading above its 50-day MA increases the value of the indicator. It doesn’t matter if the stock is 0.1% above its MA or 20% above. Just participating in the trend pushes the indicator higher.
At Tuesday’s closing bell, 90.1% of the stocks in the S&P 500 were above their 50-day MA. The horizontal blue line marks the 90% level.
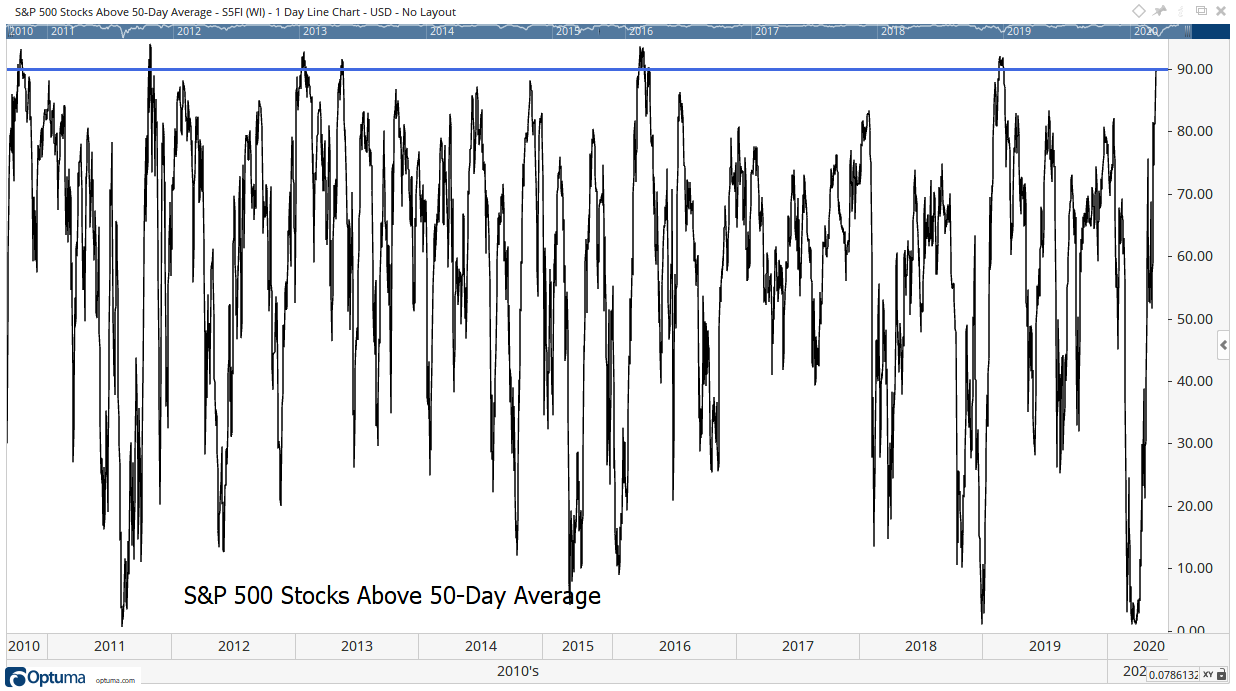
Source: Optuma
Readings above 90% are rare, with just six general occurrences in the past 10 years. Sometimes, there are multiple readings above that level, and they are grouped together in the next chart, which shows how the S&P 500 performed after each of these events.
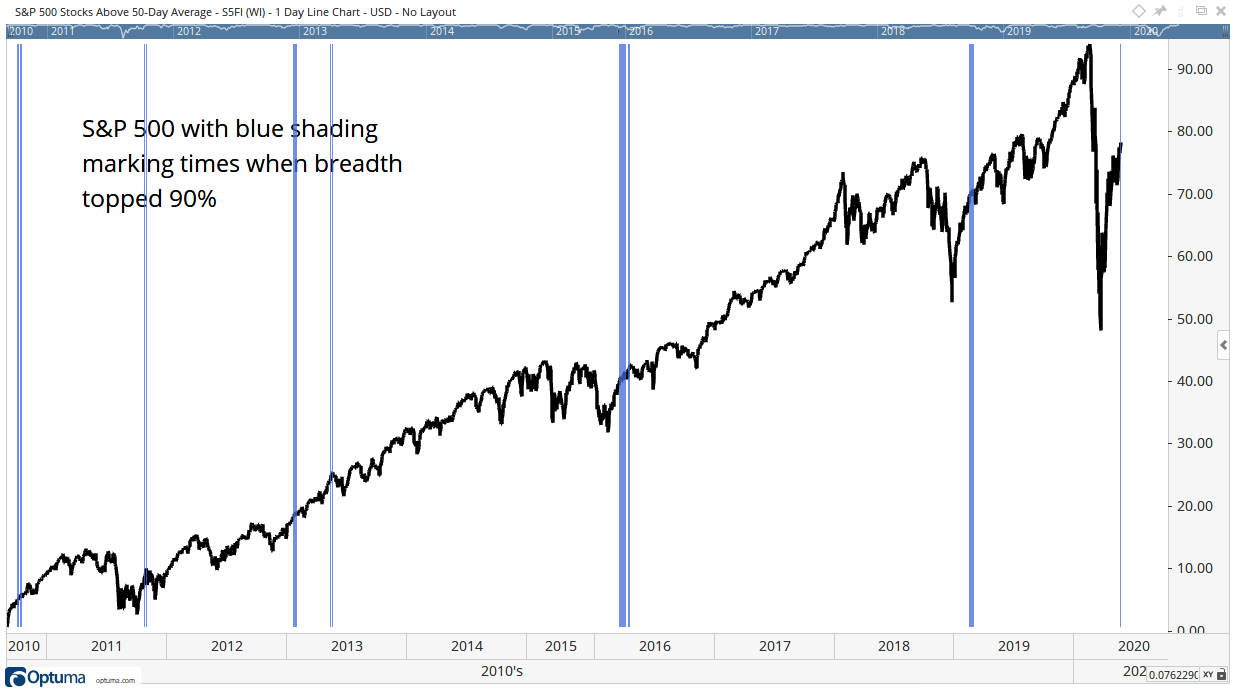
Source: Optuma
Signals generally come as the price move accelerates. The exception was in 2013, when the signal marked a short-term top.
On average, the S&P 500 gained about 0.8% in the week after this signal. That’s four times higher than the average one-week gain of 0.2% over that time. The probability of a gain is 68%, significantly higher than the 61% probability of a gain in a random week.
This is a strong trading edge and using call options could multiply the gain significantly.
This is a short-term trade. One month after this signal, the S&P 500 is up 50% of the time, so it doesn’t tell us much beyond the next week.
Editor’s note: If you’re unsure about how to trade options, check our our full guide here, and check out Carr’s One Trade options service on BanyanHill.com.
• Michael Carr is a Chartered Market Technician for Banyan Hill Publishing and the Editor of One Trade, Peak Velocity Trader and Precision Profits. He teaches technical analysis and quantitative technical analysis at New York Institute of Finance. Mr. Carr also is the former editor of the CMT Association newsletter Technically Speaking.
Follow him on Twitter @MichaelCarrGuru.