

Well, it’s Super Bowl weekend … which means it’s time for the obligatory Super Bowl Indicator.
NEW POST: Should Investors Root For Tom Brady Or Patrick Mahomes?https://t.co/CAt7gpB20Q
— Ryan Detrick, CMT (@RyanDetrick) February 3, 2021
I’ve always enjoyed watching Patrick Mahomes, quarterback for the Kansas City Chiefs, play. While at Texas Tech, he gave my beloved TCU Horned Frogs fits. But if the Super Bowl Indicator is any guide, we should all be rooting for Tom Brady and the Tampa Bay Buccaneers on Sunday.
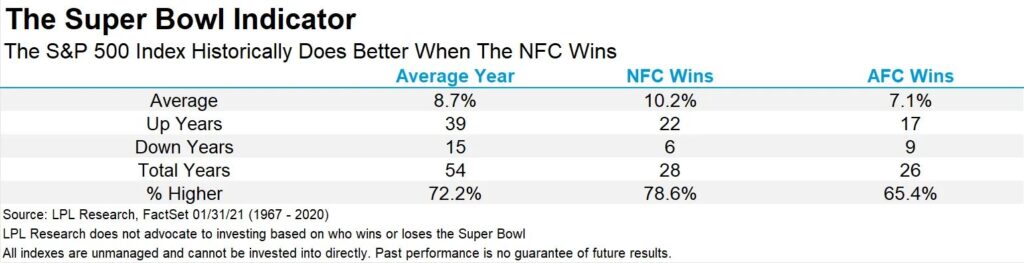
According to research pulled by LPL, the S&P 500 has returned about 8.7% on average since 1967. But in years in which the NFC team has won, annual returns have averaged 10.2%. That’s significantly better than the 7.1% on average in years in which the AFC team won.
Furthermore, the S&P 500 has returned 26.4% per year in years in which the Tampa Bay Buccaneers won the Super Bowl.
Source: LPL Research.
Clearly, there is an investment strategy here. You should immediately liquidate your IRA and mortgage your house, betting the entire proceeds on the Bucs. And when they win, you should immediately roll the proceeds back into the stock market to take advantage of the guaranteed outperformance of the S&P 500.
I’m joking, of course!
Please do not liquidate your retirement account or sell your home to bet on a football game. That‘s madness.
The Super Bowl Indicator
Let’s start with the obvious. Yes, the market has historically been up 26.4% in years when the Bucs won the Super Bowl. But the Bucs have won exactly one Super Bowl — in 2003 when the market was recovering from the tech bust.
But there is a bigger lesson to learn from the Super Bowl Indicator here, and it’s one that we at Money & Markets take seriously: Correlation is not necessarily causation.
Often in life and in the markets, a coincidence really is just a coincidence.
In a paper published two decades ago, mathematician David Leinweber and portfolio manager Dave Krider found that the best indicator for S&P 500 returns wasn’t earnings expectation or Federal Reserve policy.
Bangladeshi Butter Nonsense
 It was Bangladeshi butter production.
Leinweber and Krider built a three-factor model incorporating Bangladeshi butter production, the Bangladeshi sheep population and American cheese production that “explained” 99% of the S&P 500’s movements. Bangladeshi butter alone explained fully 95%.
Before you shake your head in bewilderment, they were also joking.
The data was very real. Statistically speaking, their Bangladeshi butter model really did “explain” 99% of the S&P 500’s movements. But the authors were well aware that it was just a fluky coincidence. They did not seriously believe that the butter output of farmers on the Indian subcontinent had any impact on American stock returns. They wrote the paper as a tongue-in-cheek warning of accepting statistics at face value and overfitting financial models.
Of course, the nuance was lost on many readers. The authors admitted that years later they were still getting the occasional phone call from money managers asking if they had fresh Bangladeshi butter figures they could share.
Sigh…
The Market Indicator Takeaway
Football is for watching, and Bangladeshi butter is for spreading over toast. By all means, have fun with these indicators. This is the sort of nerd humor I share with my old grad school buddies from the London School of Economics. But before you put a single dollar on the line, ask yourself if the indicator actually makes sense. If it seems ridiculous, it’s almost certainly a coincidence and nothing more.
If you’re interested in models that are grounded in reality, you should check out Adam O’Dell’s Green Zone Ratings. Adam rates companies based on six key financial metrics, all of which have been rigorously tested, and the results have been impressive.
Adam and I use these factors to identify our highest-conviction stock picks each month for our Green Zone Fortunes subscribers. Our monthly research newsletter comes with all the information you need to buy into these stocks, and we’ll let you know when it’s time to sell as well. If you’d like to learn more about this premium service, check out Adam’s Millionaire Master Class here.
To safe profits,

Charles Sizemore is the editor of Green Zone Fortunes and specializes in income and retirement topics. Charles is a regular on The Bull & The Bear podcast. He is also a frequent guest on CNBC, Bloomberg and Fox Business.