The latest inflation report confirms what we all know: Prices are rising rapidly. Federal Reserve officials tell us inflation pressures are transitory. Many commentators on business news channels tell us inflation is something to worry about.
The debate is, in some ways, similar to discussions about whether the stock market is overvalued. Some analysts insist it is and have held onto that opinion for decades. Others say there is room for gains.
While I do analyze valuation, I usually apply technical analysis to the data. Technical analysis focuses on the data. It provides historical context to the numbers and adapts the context to the current environment.
Technical analysts often use simple and popular tools. They add moving averages or MACD to charts and reach an opinion. There are more sophisticated approaches that require understanding the dozens of tools available to the analyst and knowing when it’s appropriate to apply a particular tool.
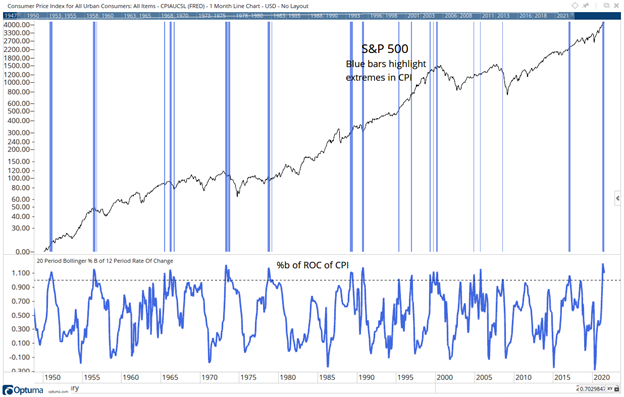
In the chart below, I show indicators based on inflation at the bottom of the chart. I show the S&P 500 at the top. Blue bars highlight extremes in inflation and allow us to see what stocks do at those times.
The Market Is Bearish With High CPI
Source: Optuma.
Rising Inflation Suggests Bearish Market
To construct the bottom panel, I started with the Consumer Price Index (CPI). I found the 12-month rate of change (ROC) of CPI. Then I added Bollinger Bands to the ROC. Finally, I measured where the ROC was relative to the Bollinger Band. That’s an indicator known as “%b” or Bollinger Percent b.
When %b is greater than 1, that means inflation is rising sharply. We saw this 16 times in the past 60 years. The S&P went up eight times and fell eight times, so we don’t have useful information from that.
Digging deeper, there were six times when %b was greater than 1 and CPI was above 5%, as it is now. Five times, the S&P 500 fell.
There is a lot of information in that analysis. High and rising inflation is bearish. With inflation above 5% and rising, the outlook is negative for the S&P 500.
I’m not quitting anything…
I’m just showing people a new way to make money in the markets.
My typical approach targets setups in individual stocks. With roughly 3,000 U.S. stocks, there’s plenty of opportunity.
But my new approach has simplified everything and boiled the markets down to one repeatable trade in the same ticker symbol.
The annual return was 132% last year. Click here to see how we did it. And most importantly, how it could benefit you.
Michael Carr is a Chartered Market Technician for Banyan Hill Publishing and the Editor of One Trade, Peak Velocity Trader and Precision Profits. He teaches technical analysis and quantitative technical analysis at the New York Institute of Finance. Mr. Carr is also the former editor of the CMT Association newsletter, Technically Speaking.
Follow him on Twitter @MichaelCarrGuru.