It’s been a wild ride for the fed funds rate — the benchmark interest rate set by the U.S. Federal Reserve.
I don’t mean just over the last few years … I mean the last several decades:
Since 1954, Fed rates have gone from 0% to nearly 20% and back again. But one of the wildest rides on the rate roller coaster has happened since 2020.
In response to the COVID-19 pandemic, the Fed started an aggressive rate-hiking campaign, pushing rates to Great Recession levels.
Last month, the central bank made an unprecedented move by cutting rates back 50 basis points, leaving investors and analysts wondering what would happen next.
Now, none of us can predict the future, but I’ve pulled the curtain back on decades of rate-cutting history to see how the market has responded to these cuts and give us a glimpse at what the Fed may do in its November meeting.
The Art of the Rate Cut
The Fed is nothing if not methodical when it comes to trimming rates.
There are three primary reasons why the Fed decides to cut rates:
- Normalizing — After a period of higher rates, policymakers may determine that inflation is under control. Therefore, it will boost the economy by cutting rates. The intent is to kick the economy into action while minimizing significant risks.
- Recession — If the Fed sees a recession on the horizon (or if the economy is already in a technical recession), a rate cut may stem the tide or prevent an economic downfall.
- Panic — Big events can shake up the market. These panic cuts occur in response to a regional or global event that threatens to tank the market. We saw this when the COVID-19 pandemic hit.
As there are different rationales for rate cuts, there are also different market outcomes.
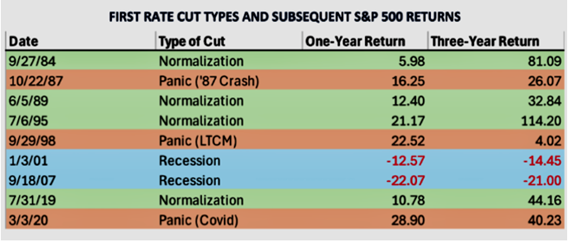
For example, when the Fed made normalizing cuts — in 1984, 1989, 1995 and 2019 — the market experienced positive returns in the following 12 to 36 months.
However, after recession cuts — like those in 2001 (dot-com bubble bursting) and 2007 (the Great Recession) — the market turned negative in the following years. You can see all of the percentage gains and losses in the table below:

The good news for investors is that September’s 50-basis-point cut fits the normalizing mold after years of higher-than-average rates.
Regardless of the reason, since 1970, the forward returns of the S&P 500 following rate cuts have been strong:
The only times the S&P 500 has been down three years after a first rate cut was 1971, 2001 and 2007. The benchmark has never been down five years after a first rate cut.
What’s In Store for November
After its larger-than-expected rate cut in September, speculation abounded on what the Fed will do in its November meeting.
Since that cut, strong retail sales and job growth data have blown the doors off expectations, suggesting a slow-down for the Fed’s plans.
However, four Fed policymakers told Reuters this week they remain in favor of rate cuts, even if at a slower pace (think 25 basis points rather than 50).
On Bloomberg, estimates suggest just that … a 25-basis-point rate cut in November.

The rationale here is that the Fed still wants to bring inflation growth down to 2% and maintain a healthy job market — and neither of those missions has been wholly accomplished yet.
What It Means: Even the smallest of rate cuts in November should add fuel to the current market rally.
And that’s just one of three converging events that Adam O’Dell and the rest of the Money & Markets team are tracking now.
This convergence only happens once every 25 years, and market-makers are already positioning themselves to profit from it.
You don’t want to get left behind.
As part of his brand-new presentation for his Green Zone Fortunes premium investing service, Adam has included a special report pointing to three stocks he believes could roar higher…
Click here to watch his Super Boom presentation now and see how you can gain access to that special report. It’s just one of many perks you’ll get by joining Green Zone Fortunes today.
That’s all I have for today.
Safe trading,

Matt Clark, CMSA®
Chief Research Analyst, Money & Markets


