
“Number of Nasdaq Stocks Down 50% or More Is Almost at a Record.”
That’s the headline Yahoo went with for a recent Bloomberg chart and article.
About 40% of the stocks included in the Nasdaq Composite are trading at least 50% below their 52-week high — similar to the bear markets in 2000, 2008 and 2020. The chart also shows the Nasdaq reached this level during bull markets in 2016 and 2018.
A-D Line Reveals the Truth About the Nasdaq
The chart shows that capitalism works.
Small companies turn to the Nasdaq Exchange to raise funds for operations. It’s the home of speculative companies that may or may not succeed.
For example, Nasdaq is the home of Google, a search engine that succeeded. But it was also home to Lycos, Altavista, Yahoo, Excite, Infoseek, Ask Jeeves and other forgotten search engines.
In a vibrant economy where entrepreneurs strive for success, we expect to see more failures than successes. That’s why the advance-decline (A-D) line for the Nasdaq has been in a downtrend for decades.
Nasdaq A-D Line Since 1997
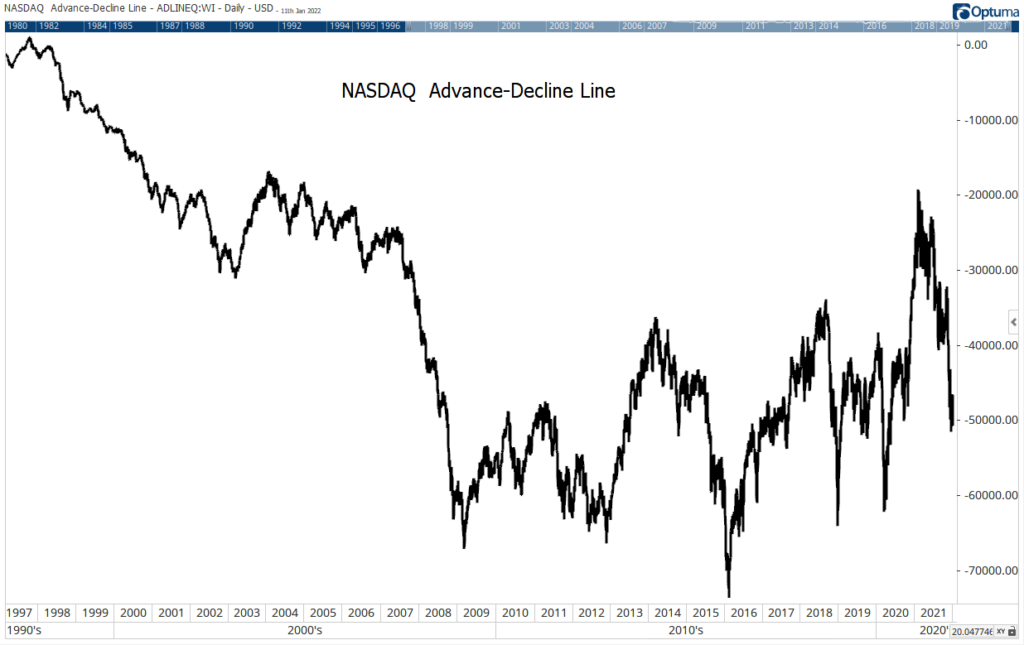
The A-D line subtracts the number of stocks that closed lower on any given day from the number of stocks that closed higher. In a bull market, we expect advancing issues to outnumber decliners, and we should see an uptrend in the A-D line. In bear markets, declines should be more plentiful, creating a downtrend in the indicator.
That is what we see on the New York Stock Exchange, where investors trade large, financially sound companies.
NYSE A-D Line Since 1996
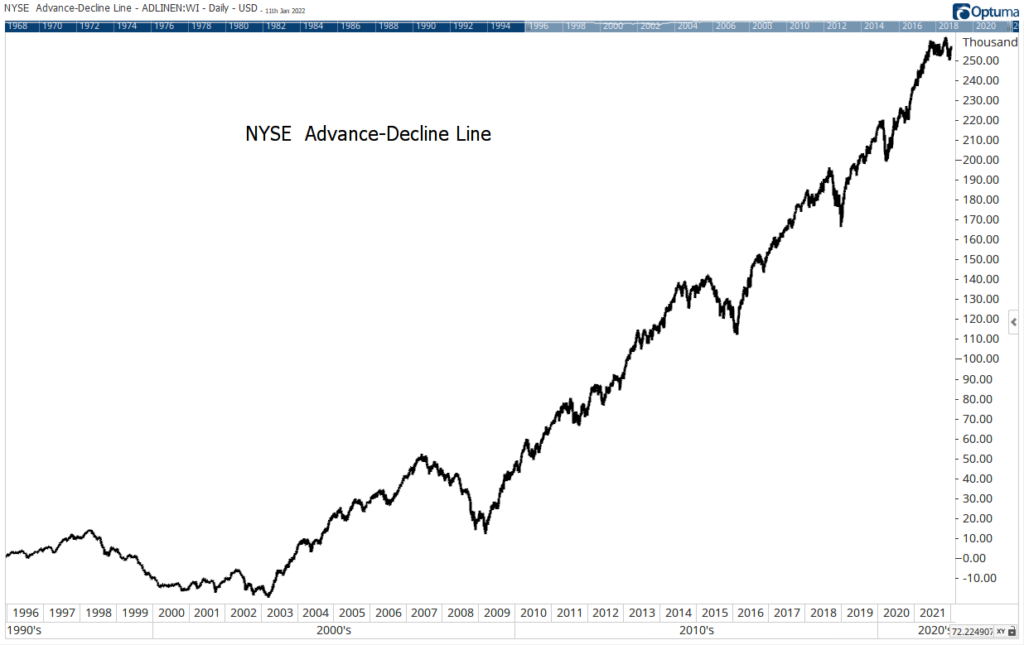
The two charts cover the same time frame but show different trends: The Nasdaq is for speculation, while the NYSE is for investment.
The fact that a large number of Nasdaq stocks are trading at least 50% below their 52-week high tells us investors are excited and willing to accept risk in speculative companies. By itself, that’s a bullish factor.
Click here to join True Options Masters.