Yield curves are a useful indicator. Many investors track the Treasury yield curve as a recession indicator.
This curve shows interest rates or yields on Treasury debt at various maturities. In a growing economy, yields are higher for longer-term debt. This makes sense since there should be more inflation risk over ten years than in the next six months. In normal environments, the yield curve rises as the time to maturity increases.
As the economy slows, traders become nervous about the short term, and rates for short-term debt rise as long-term Treasury yields hold steady or fall slightly. The increase in short-term yields results in an inverted yield curve where short-term yields are higher than long-term yields.
At the short end of the curve right now, traders are telling us the current environment isn’t normal.
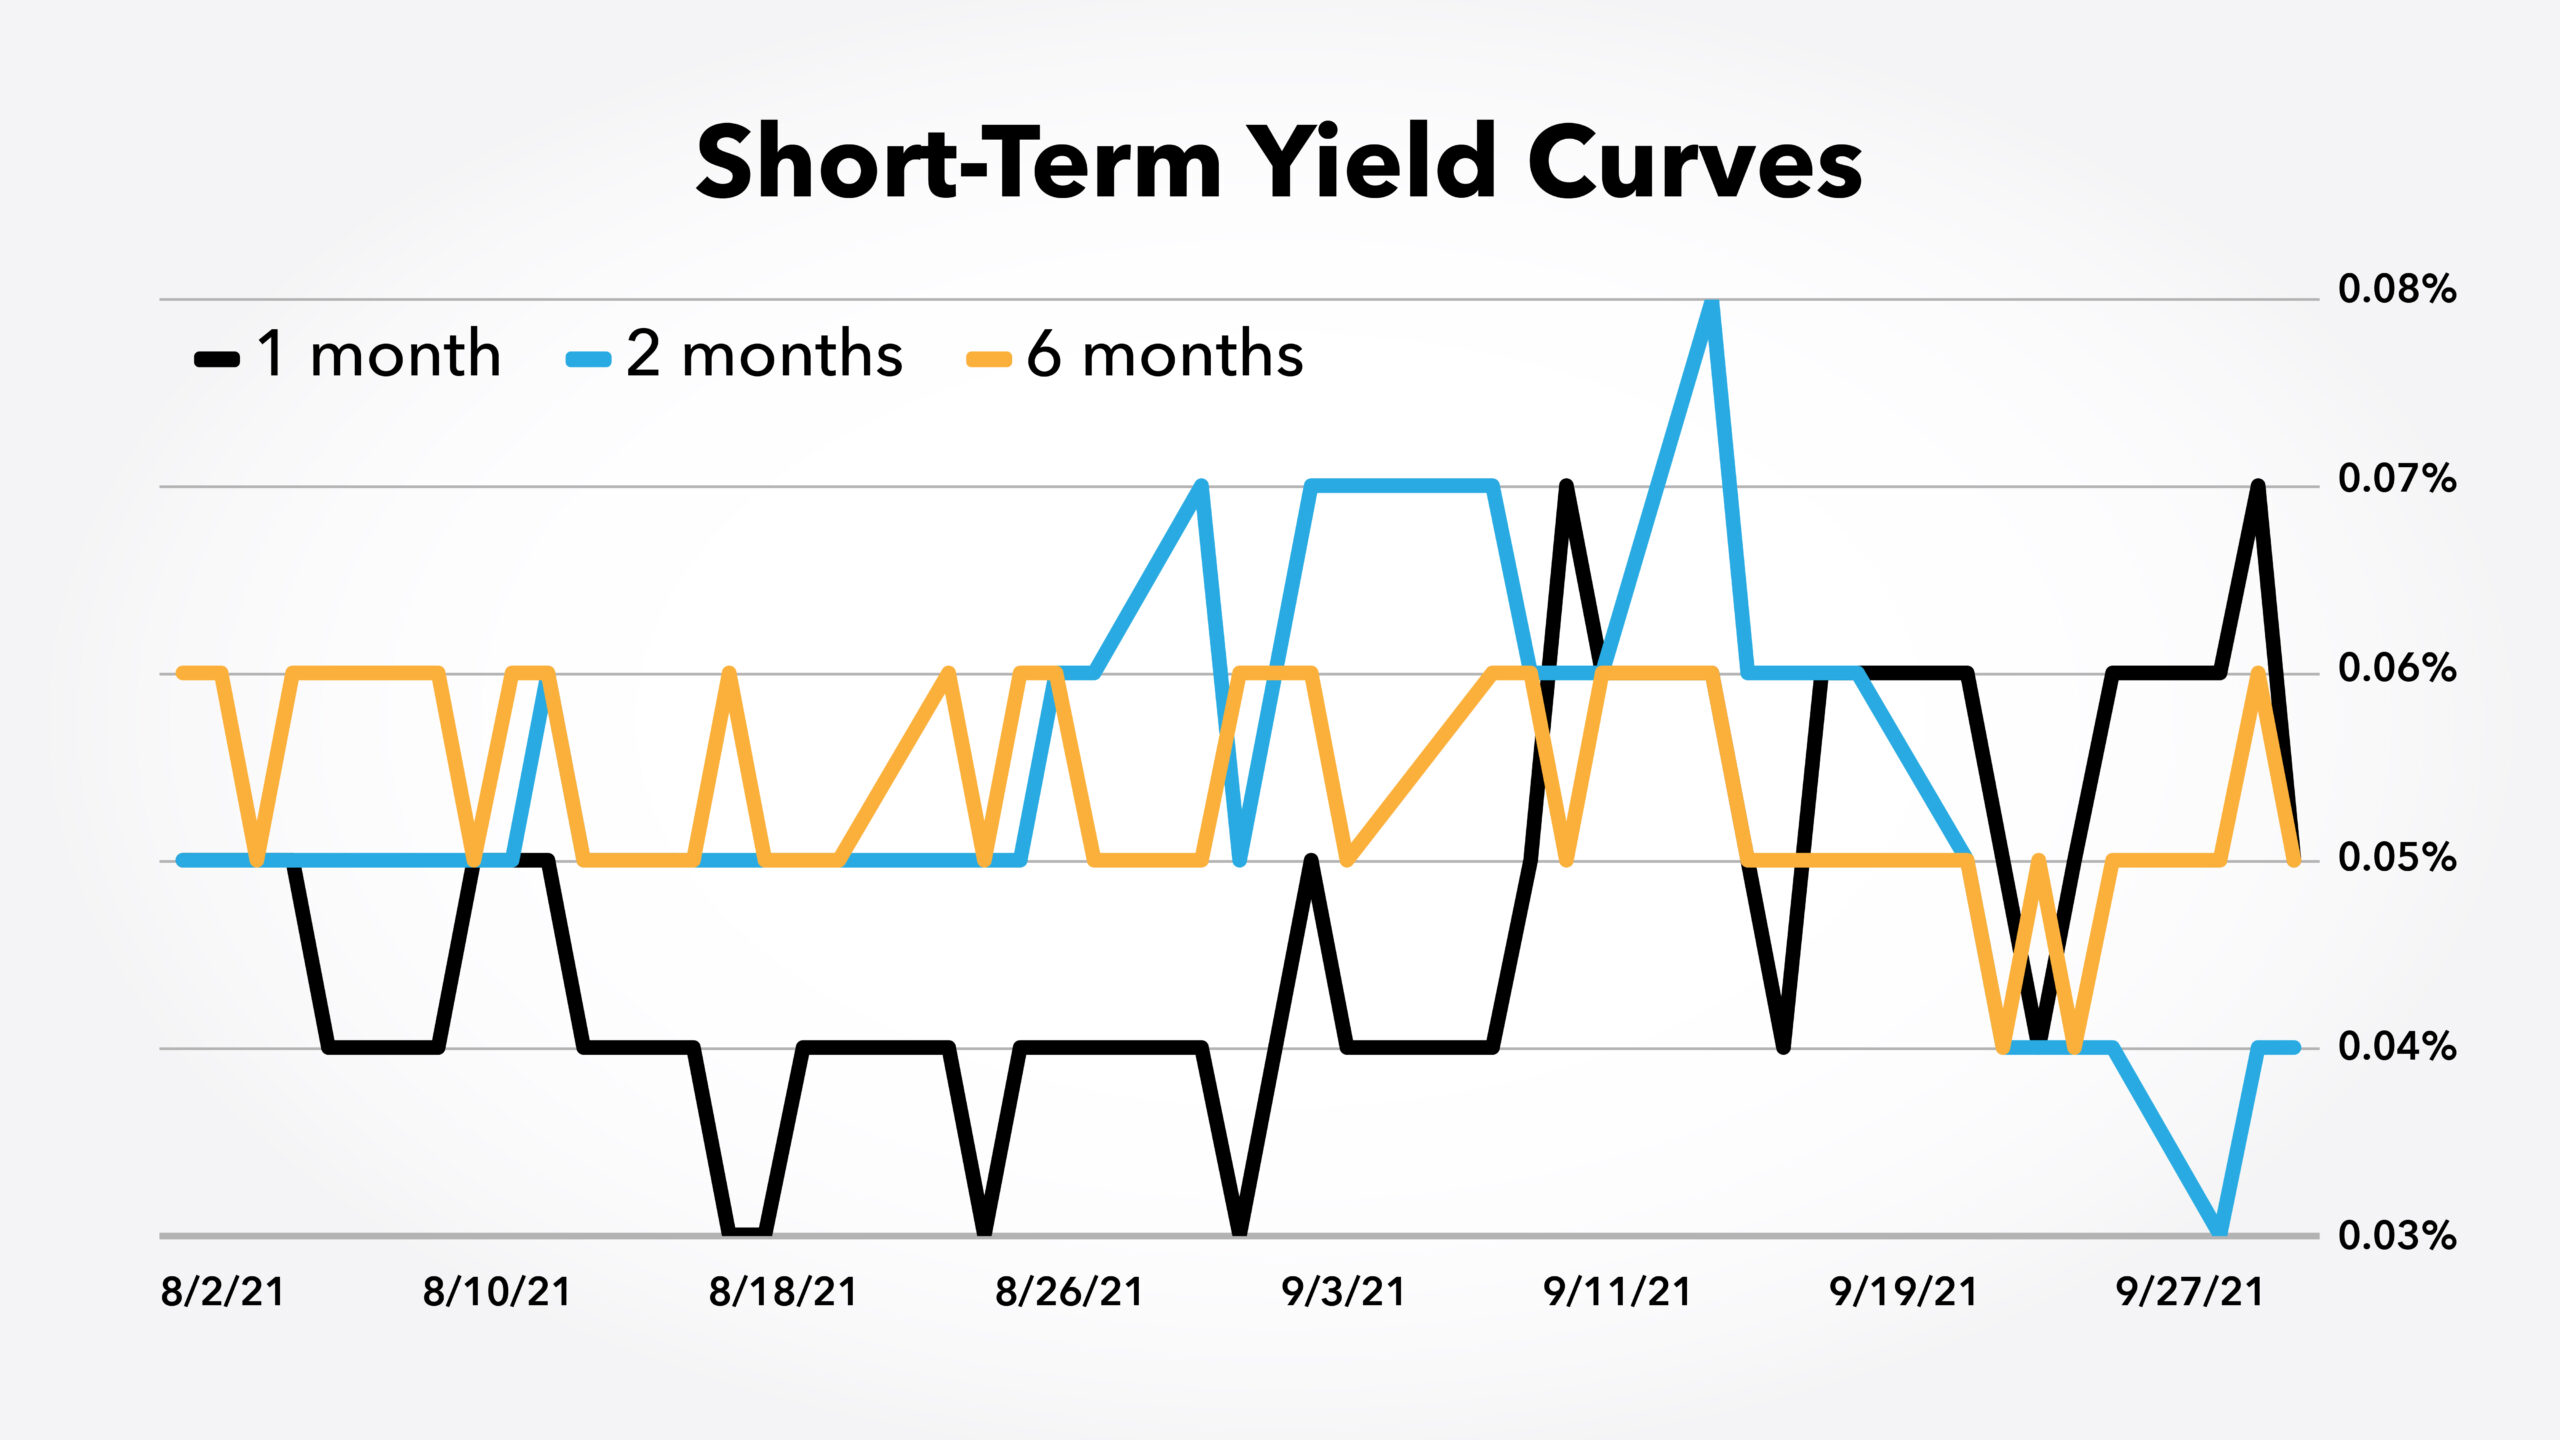
The chart below shows the yield curve for Treasury bills maturing between one month and six months.

Source: U.S. Treasury.
Six-month yields should be above two-month yields, which should be above one-month yields. We saw that pattern for most of August. But in late August, yields on the two-month jumped, and the curve has been abnormal since then.
This shows traders are worried about Congress, where bills to fund the government and raise the debt ceiling need to be passed.
The Yield Curve Is a Political Indicator
The government’s fiscal year ends on September 30. Generally, Congress struggles to get a budget approved by that date. They pass a series of continuing resolutions allowing government agencies to operate spending at the same level as they did in the previous fiscal year.
Congress also regularly raises the debt ceiling, in effect lifting the Treasury’s credit limit. This occasionally leads to a debate but is often a routine process. This year it has not been routine, and the government could default on its debt within weeks if Congress fails to act.
This year, partisanship and intra-party debates have held up these important bills, and traders are worried that the different factions will struggle to compromise. The yield curve is now a political indicator, and short-term rates will tell us about the health of Congress.
I’m not quitting anything…
I’m just showing people a new way to make money in the markets.
My typical approach targets setups in individual stocks. With roughly 3,000 U.S. stocks, there’s plenty of opportunity.
But my new approach has simplified everything and boiled the markets down to one repeatable trade in the same ticker symbol.
The annual return was 132% last year. Click here to see how we did it. And most importantly, how it could benefit you.
Michael Carr is the editor of One Trade, Peak Velocity Trader and Precision Profits. He teaches technical analysis and quantitative technical analysis at the New York Institute of Finance. Follow him on Twitter @MichaelCarrGuru.


