
Managing Editor’s Note: Amber Hestla is the new senior analyst on the True Options Masters team. Each week, she will highlight moves that we should all be paying attention to as investors. If you’d like more insights from Amber, click here to sign up for the free True Options Masters daily e-letter. — Chad Stone, managing editor, Money & Markets
With the S&P 500 Index near its all-time high, investors should be seeing their account balances near all-time highs as well. However, that’s probably not the case for everyone. Under the surface, this bull market is weakening.
The chart below shows that 19% of stocks in the S&P 500 are at least 20% below their 52-week highs. A 20% decline is commonly used as the minimum level for a bear market. So the chart shows the number of stocks in the Index that are in bear markets.
S&P 500 Bearishness
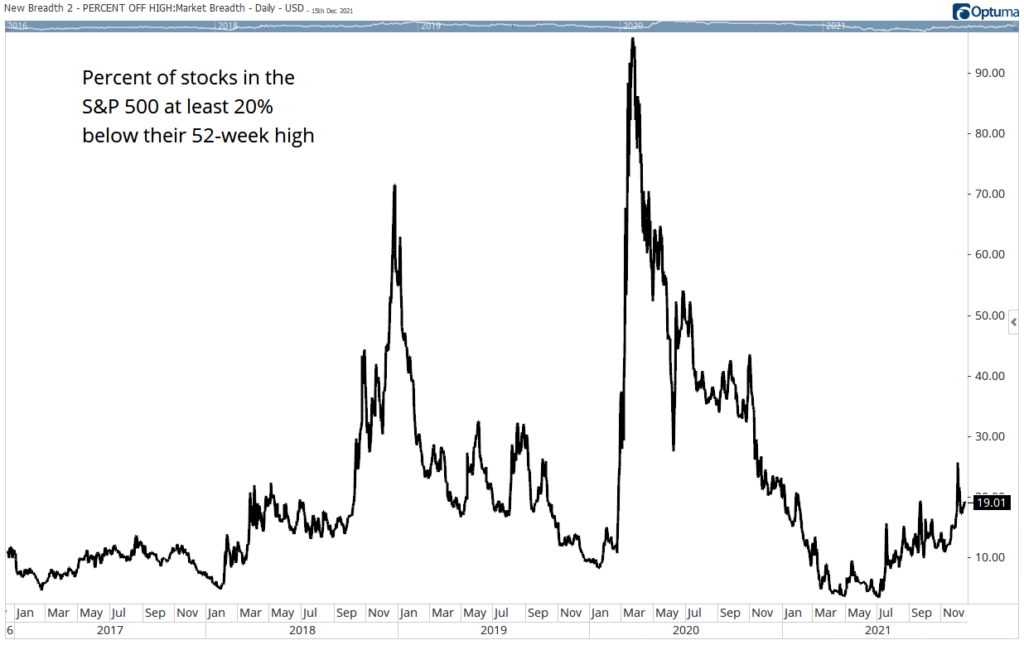
Source: Optuma.
For small caps, the picture is even worse with 60% of the stocks in the Russell 2000 Index trading at least 20% below their 52-week highs.
This isn’t as extreme as it may sound. Over the past five years, on an average day 48% of stocks in the small-cap index were at least 20% below their highs.
Small Cap Bearish Trend
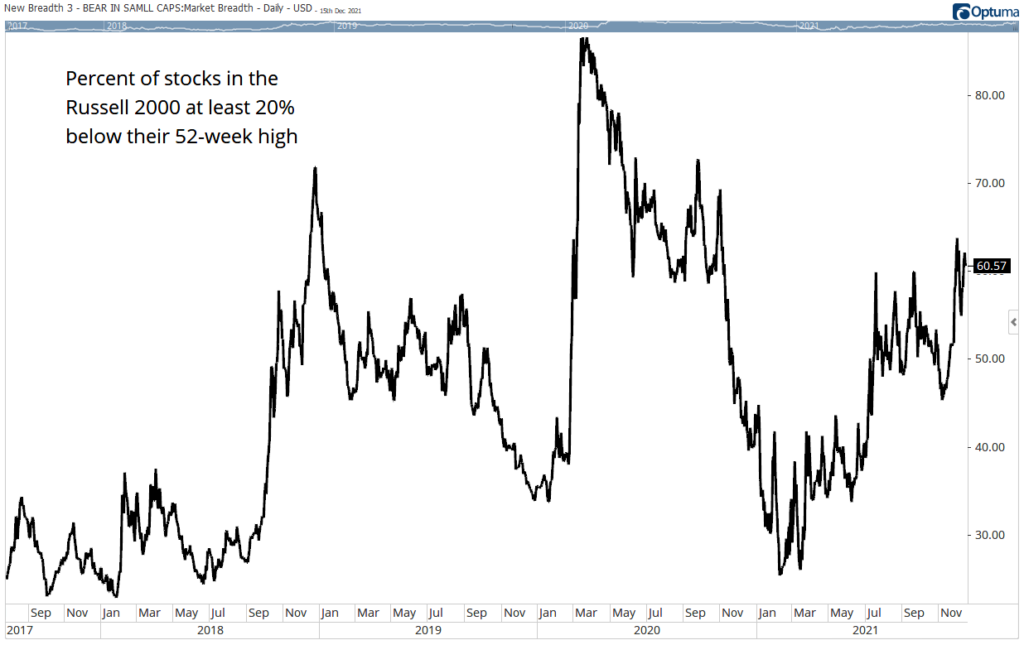
Source: Optuma.
Small-Cap Stocks and Bear Markets
This demonstrates why small caps require detailed analysis.
With large-cap stocks, a rising tide tends to lift all boats. Large caps move with a high degree of correlation to each other. Small caps are less correlated and stock picking is more important in that part of the market.
While individual small-cap stocks are less likely to move higher, the ones that do move up are more likely to deliver large gains. Since 1926, according to Ibbotson Associates, small caps have delivered an average annual return of more than 16% compared to just 12% a year for large caps.
In the short run, we are facing a challenging market environment, but there are signs of a new bull market. The percentage of small caps in a bear market is near levels that were associated with significant price lows in the past. This is bullish for large caps because small caps tend to be the leaders in the strongest bull markets.
Now could be an ideal time to analyze small caps to find the next bull market leaders.
Click here to join True Options Masters.