“Be fearful when others are greedy and greedy when others are fearful.”
That is one of Warren Buffett’s most famous quotes regarding the stock market, and it is a contrarian approach that has made him one of the stock market’s greatest investors and the world’s richest men.
The sentiment basically boils down to avoiding overvalued assets loved by the investment public, and buying cheap assets unloved by the public. Buffett is mainly a long-term investor and and business mogul, but the sentiment applies to short-term trading.
Per InvestorPlace:
Contrarian Indicators
Here’s one method that tests negative irrationality. We can look at a contrarian indicator like … the number of S&P 500 components that are trading below their 200-day simple moving average (SMA).
Regular readers are familiar with moving averages. A moving average is simply the average closing price of a stock over a particular lookback period. Moving averages can be long-term in nature or short term in nature. Traders often look at 50-day and/or 200-day moving averages to analyze stock trends.
If a stock is in an uptrend, it will usually be above its moving average. It can be a warning sign when a stock starts trading below its long-term moving average.
We need to know what percentage of the S&P 500 looks “weak” right now.
Believe it or not, there is a chart that measures this. It’s called the weekly chart of the S&P 500 Stocks Above 200-Day Average (S5TH).
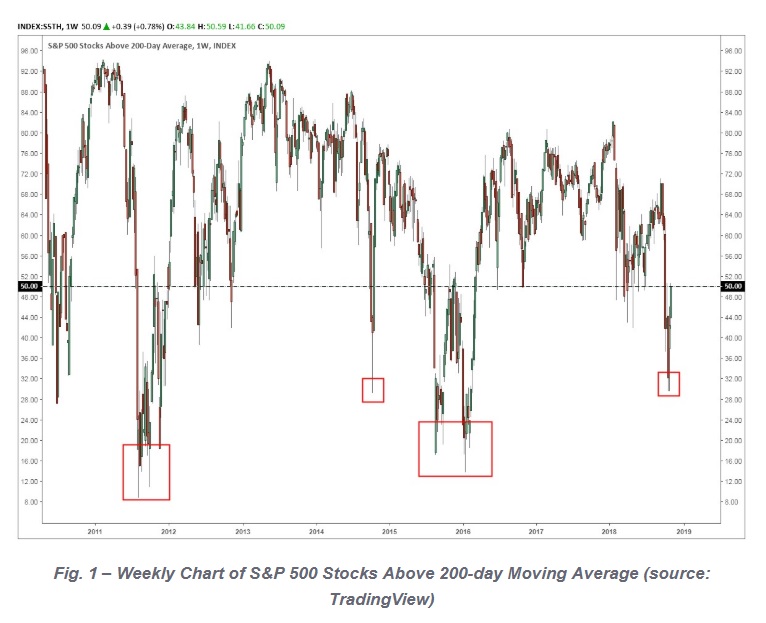
You can see it in the chart … and you can see that only about 50% are currently trading above their 200-day SMA. It even dipped below 30% earlier last week.
You can guess where we are going with this. A deeply oversold reading indicates that people have become very fearful of the market.
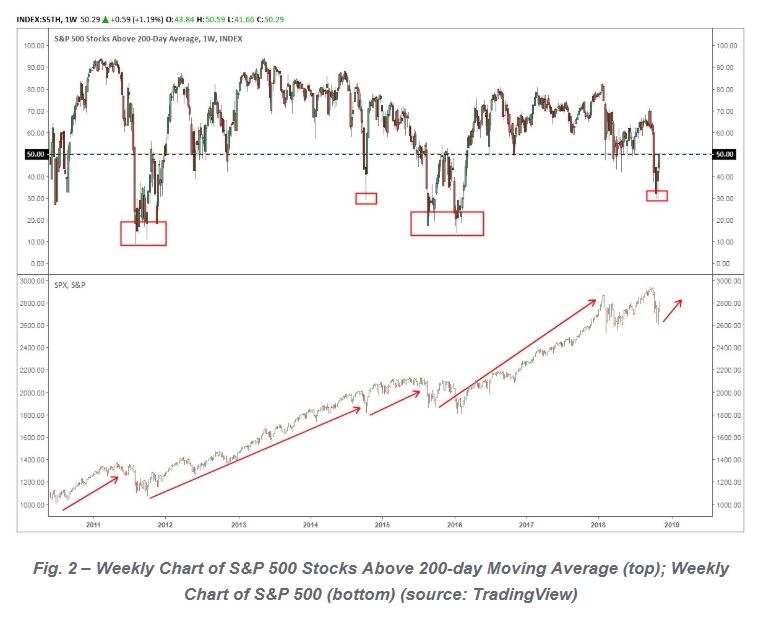
So, taking a cue from Warren Buffett, we want to “fade” the crowd and go long. History shows that it’s the right move.
Here’s a table showing dates when less than 30% of the S&P 500 stocks were trading above their 200-day SMA and the subsequent rally in the S&P 500 index from those lows to the next top.
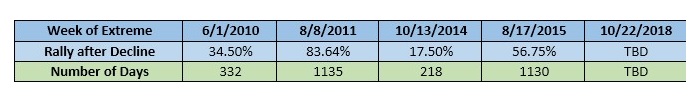
Three-year rallies followed the signals in 2011 and 2015. The average price gain during the first 50 days after the signal was 11%, which is an annualized return of 114%.
The advantage belongs to the traders who can be rational. Even when we know investors tend to move between extremes of irrationality.
There is always something to worry about. If it isn’t tariff worries, it’s the Fed, or interest rates, or whatever … but the fact is, earnings are looking great.
And companies will once again start buying back their stock as earnings season winds down.
This could be the best time in three years to be a buyer … While the herd is tiring itself out running in the wrong direction.
With all of this in mind, our Strategic Trader portfolio skews heavily toward the bullish camp right now.