For some reason, the price-to-earnings (P/E) ratio is popular. Many investors believe the average ratio is about 17. They think if they buy when the P/E ratio is below 17, they are likely to earn a profit.
That’s not true. P/E ratios are volatile over time. The chart below shows the ratio is never stable enough to serve as an investing tool.
The Cyclically Adjusted Price-to-Earnings Ratio
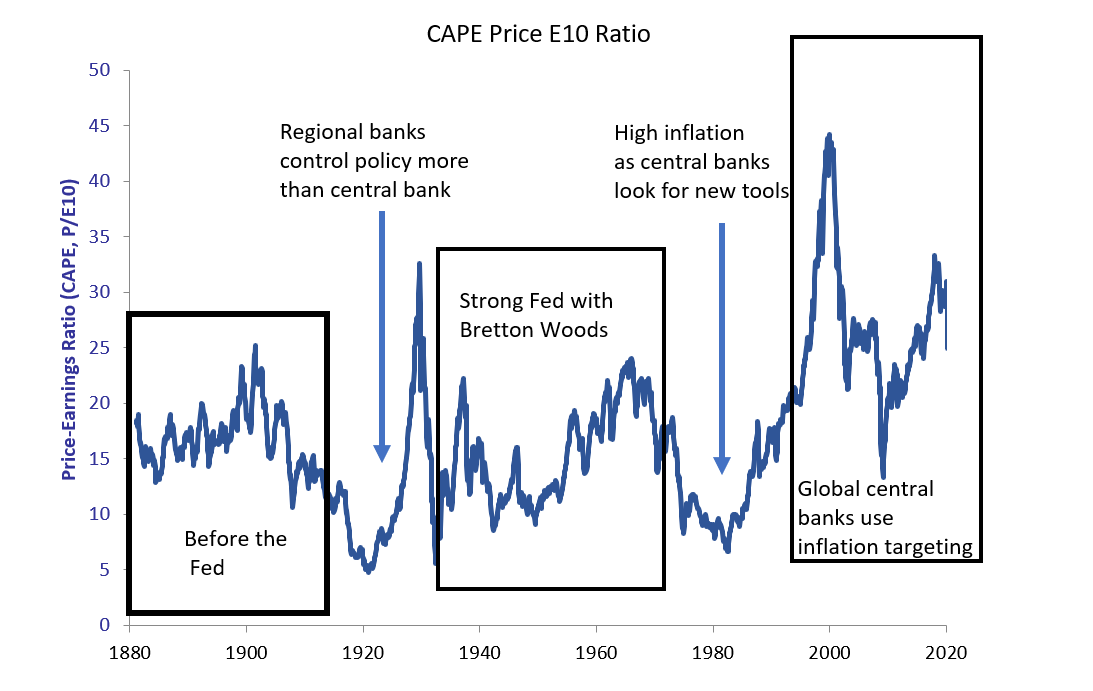
Source: data from Dr. Robert J. Shiller.
The chart above is the CAPE, or the cyclically adjusted price-to-earnings (CAPE) ratio. CAPE adjusts the ratio for inflation. It uses average earnings over 10 years, smoothing the ups and downs of the business cycle on earnings.
Nobel-prize winning economist Dr. Robert Shiller developed this ratio. He noted some advantages to the CAPE.
Adjusting for inflation focuses on the earnings power of the company. If we ignore inflation, we see earnings rise when prices are rising rapidly. We also see lower earnings when prices are falling. CAPE evens out the impact of inflation.
CAPE also evens out the ups and downs of the business cycle. In recessions, companies earn less than they do in boom times. CAPE averages the booms and busts, showing the company’s performance over time.
Even after these adjustments, the chart shows there are wide swings in the CAPE. Some of the fluctuation is explained by the central bank.
Before there was a central bank, CAPE averaged 16. At that time, the economy swung from expansion to contraction over about four years, on average. Recessions and short periods of unemployment were common.
To eliminate the pain of economic swings, the Federal Reserve was founded.
After the Fed began operations in 1914, CAPE initially dropped as investors worried the new central bank would choke off economic growth.
Note that low values of CAPE indicate investors are worried about the risk of stocks. High values show a comfort with risk.
After a few years, the Fed proved to be largely hands-off and a bubble developed. The crash in 1929 showed the Fed was unprepared to manage the economy. Regional banks set policies for their districts. Without central management, the economy spiraled into the Great Depression.
By the mid-1930s, the Fed established a national policy. After World War II, countries agreed to use the U.S. dollar as the world’s reserve currency. As long as the Bretton Woods agreement held, CAPE rose as risks subsided.
Inflation appeared unexpectedly in the 1970s and global currency controls broke down. CAPE fell, indicating high risk, as the Fed searched for new tools.
By the 1990s, the Fed and other central banks began targeting annual inflation of 2%. Stock markets entered a golden era and CAPE averaged 26 in the past 30 years.
What happens next will be determined by the Fed. Declines in CAPE indicate investors are losing faith in the Fed’s ability to grow the economy in the future. Fed officials admit they are searching for new tools.
In this environment, it’s likely CAPE will fall below 10. That will involve both a decline in earnings and a decline in stock prices in the long run.
A note from author Michael Carr: While it’s likely there will be lower gains for buy-and-hold investors in the long run, there will be opportunities for short-term traders. Soon, I’ll be sharing details on a strategy I’ve been trading for a local animal rescue. This account shows a gain of more than 76% from Jan. 1 to May 31. To learn more, click here.
• Michael Carr is a Chartered Market Technician for Banyan Hill Publishing and the Editor of One Trade, Peak Velocity Trader and Precision Profits. He teaches technical analysis and quantitative technical analysis at New York Institute of Finance. Mr. Carr also is the former editor of the CMT Association newsletter Technically Speaking.
Follow him on Twitter @MichaelCarrGuru.