October of 2018 has been the single-worst and most highly volatile month for the stock markets since 2008 at the beginning of the Great Recession.
Since their early October highs, the S&P 500, Dow Jones Industrial and Nasdaq indexes are down between 7 and 10 percent each, but how are this month’s stock market corrections different than past corrections?
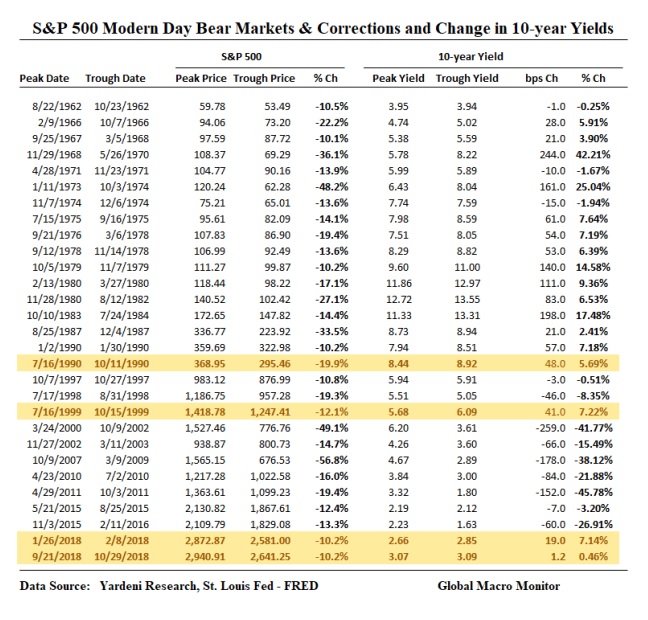
A recent article by Global Macro Monitor notes this year’s two S&P 500 corrections (February and October) have coincided with a rise in the 10-year Treasury yield, which has only happened once in two decades, making these stock market corrections especially peculiar.
Here is Global Macro Monitor’s quick breakdown in a recent post:
Just a quick note and some data to bolster our last post and concern that Treasury yields are not coming in during this stock market correction.
The table illustrates that the this year’s two S&P 10 percent corrections have coincided with a rise in the 10-year Treasury yield. This is very rare, at least in recent history, and has happened only once in the last 20 years, and that was a special case due to a massive flight to quality and complications around the Russian Debt Default and LTCM crisis.
Flight To Quality
In general, when stocks fall by 10 percent, there is a flight to quality and yields fall on Treasury securities.
Yes, the 10-year is down from its peak of 3.25 percent but higher than when the S&P 500 peaked in September. One can fiddle with the data and use intraday highs and lows, but you get our point, we hope.
The Gathering Storm In The Treasury Market
If you haven’t read our beast of a post on the structural changes in the Treasury market, we suggest you run to it now! Click right here: The Gathering Storm In The Treasury Market 2.0
We also recommend our most recent piece, Where The Next Financial Crisis Begins.
Keep this on your radar folks, we think it is signaling there are structural changes taking place in the global capital markets.