One of the biggest factors driving the stock market boom since the Great Recession has been debt-funded stock buybacks, with 2018 being the most active year on record for buyback activity.
There are extreme consequences from central bank market-meddling and we are about to learn this lesson once again.
And yet even with companies spending record amounts of money to buy back their own stock — thanks in part to the massive corporate tax cuts enacted by President Donald Trump — the market still tanked over the final three months of 2018.
So what happens when the buybacks end?
Forbes contributor Jesse Colombo tackled that important question in his latest piece.
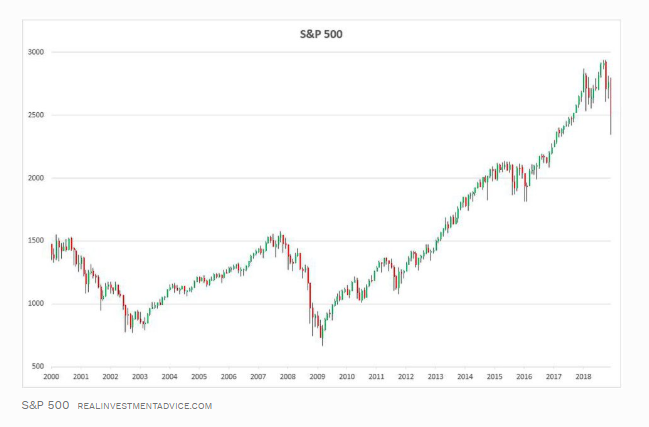
From the bear market low in March 2009 until the recent peak, the S&P 500 surged by approximately 300%:
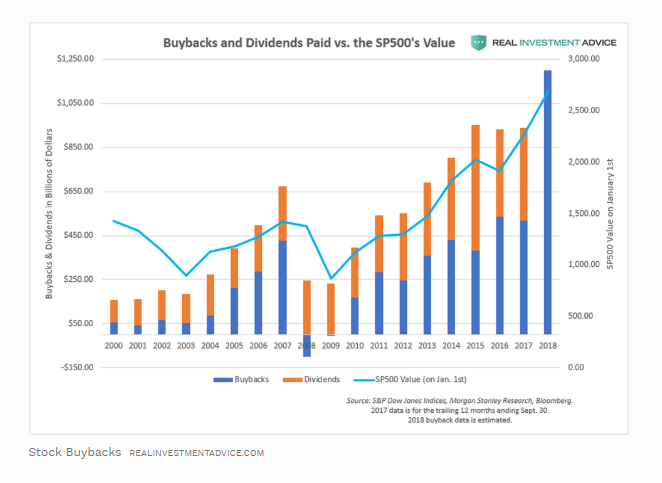
The chart below shows how stock buybacks have been rising steadily since 2009. As I explained several months ago, U.S. corporations have taken advantage of ultra-low bond yields to borrow heavily in the corporate bond market to fund buybacks (I believe that a corporate debt bubble formed as a result of this borrowing).
The eventual bursting of the U.S. corporate debt bubble will exacerbate the ultimate decline in stocks. As I wrote a few months ago:
To put it simply, the U.S. corporate debt bubble will likely burst due to tightening monetary conditions, including rising interest rates. Loose monetary conditions are what created the corporate debt bubble in the first place, so the ending of those conditions will end the corporate debt bubble. Falling corporate bond prices and higher corporate bond yields will cause stock buybacks to come to a screeching halt, which will also pop the stock market bubble, creating a downward spiral. There are extreme consequences from central bank market-meddling and we are about to learn this lesson once again.
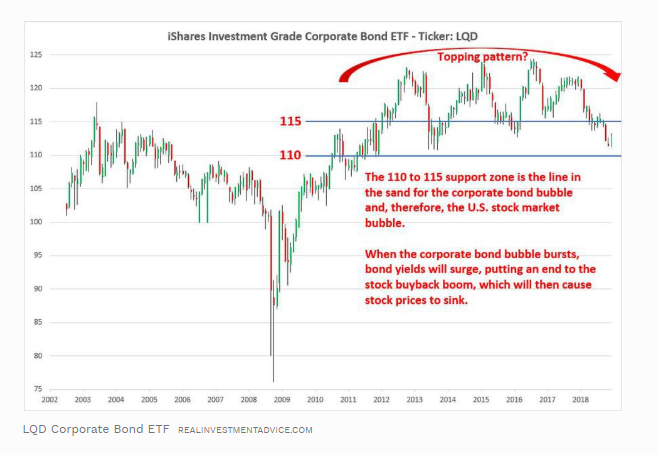
The LQD iShares Investment Grade Corporate Bond ETF is a good proxy for the U.S. corporate bond market. When the ETF falls in price, corporate bond yields are rising and vice versa. The 110 to 115 support zone is the key line in the sand to watch in the LQD ETF. If LQD closes below this zone in a convincing manner, it would likely foreshadow an even more powerful bond and stock market bust ahead.
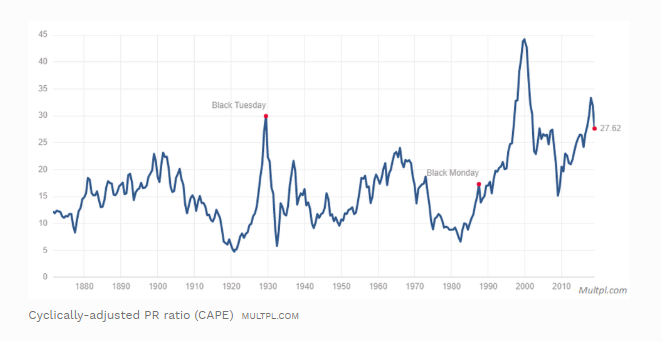
Numerous valuation measures show that the U.S. stock market is still quite overvalued despite the recent rout. The chart below of the Shiller PE ratio (cyclically-adjusted PE ratio) shows that the U.S. stock market’s valuation is still in rarefied territory. It’s going to take much more than the decline since early-October to unwind this bubble – make no mistake about that.
Please watch my presentations about the U.S. corporate debt bubble and stock market bubble to learn more:
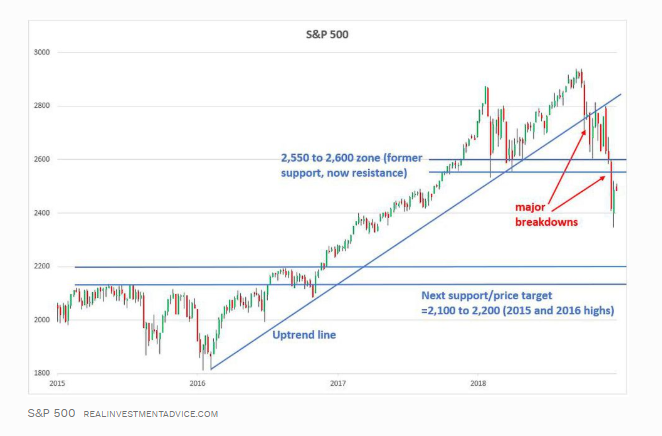
From a technical analysis perspective, the S&P 500 has experienced two major technical breakdowns in the past few months: a break below the uptrend line that started in early-2016 and the more recent break below the 2,550 to 2,600 zone, which are both omens of further weakness ahead. The next major support level and price target to watch in the S&P 500 is the 2,100 to 2,200 zone (the 2015 and 2016 highs).
While many investors are hopeful that the current bounce is the start of another leg up, I am not so optimistic: the trend is still down and the market has an incredible amount of excess that still needs to be worked off. For now, I am watching how the S&P 500 acts at its key 2,550 to 2,600 resistance level and how the LQD corporate bond ETF acts at its 110 support level.