Last year was great for investors.
The S&P 500 posted a 24% gain from start to finish — including a 15% bump over the last two months of the year.
And 2024 started strong with the index jumping 11% to a new all-time high in late March.
Investors were banking on the idea that the Federal Reserve would start trimming interest rates in the coming months.
Then, last week happened.
One of the Fed’s key gauges of inflation — the Consumer Price Index (CPI) — came in hot at 3.5%, sending stocks lower. The S&P 500 dropped 1% on Wednesday.
After recovering slightly on Thursday, the index sank lower to close the week. And I’m not sure we’re past the hangover from a great 2023.
Here’s why…
S&P 500 Futures Point to Down Shift
Following the bad CPI news, S&P 500 futures posted an unsettling mark.
For the third time in eight sessions, futures contracts tied to the index hit what’s called an “outside day.”
This happens when the price of an equity reaches higher highs and lower lows than the day before. A negative “outside day” is when the stock opens higher, trades at a new high, then pulls back to trade at a lower low and closes below the previous low.
Here’s what the S&P 500 futures looked like by Thursday afternoon:
S&P 500 Futures Shows 3 “Outside Days”
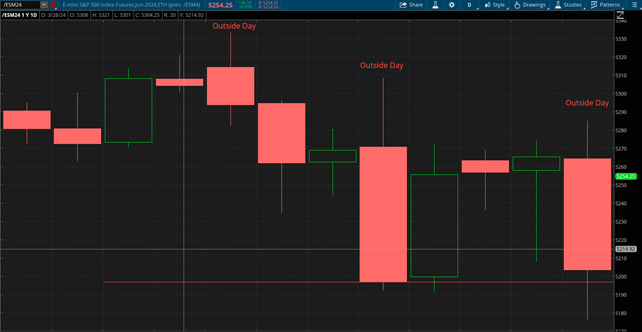
You can see the three “outside days” on April 1, April 4 and April 10. This is where futures traded above the previous day’s high, fell back and closed lower than the previous day’s low.
A few “outside days” don’t indicate a downward trend on the horizon for the S&P 500.
It could indicate a short-term blip, considering the strong uptrend the index has been in since 2023.
But something else stands out as a reason to consider a broader pullback may be coming.
S&P 500 Rates “Neutral”
The whole Money & Markets team shared some additional research on the broader index on Friday (if you missed that, click here to check it out), using Adam’s Green Zone Power Ratings system to examine every stock in the index.
Here’s what I found when I performed an X-ray on the entire index.
On average, all stocks in the S&P 500 rate 49 out of 100, or “Neutral.” If this were an ETF, our recommendation would be to watch — not buy or sell.
Drilling deeper into factor ratings, we can see where the S&P 500 shines… and where it falls short:
- Momentum — 49.
- Size — 9.
- Volatility — 59.
- Value — 40.
- Quality — 70.
- Growth — 62.
Of all the stocks on the index, a little more than 50 rate “Strong Bullish” on our system. However, more than 70 rate “Avoid” and more than 120 are “Neutral.”
S&P 500 Rates “Neutral”
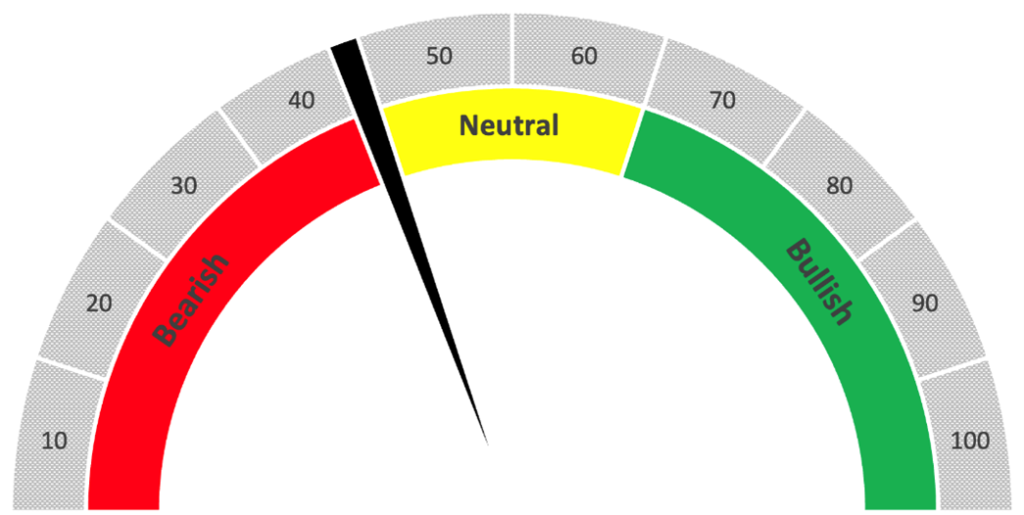
This means that treated like any other exchange-traded fund, the S&P 500 is not a fund to buy right now.
There are more stocks on the index rated “Avoid” than “Strong Bullish” and even more considered “Neutral.”
This doesn’t suggest a massive downtrend in store for the index, but it should give you pause.
While the broader index itself may be something to avoid, there are, of course, some gems in it.
That’s where the power of the Green Zone Power Ratings system becomes so valuable. Rather than looking to buy an entire index of stocks — an index that contains more “fat” than “meat” at this point — our system helps you drill down and find the best of the best to help bolster your portfolio.
Until next time…
Safe trading,

Matt Clark, CMSA®
Research Analyst, Money & Markets