
Traders often say things they heard from someone else. Some sayings just become common wisdom without anyone knowing the source. One example is the statement that “the trend is your friend.”
It’s obvious advice. If prices are going up, buy. If prices are going down, don’t buy. You could even sell when prices are going down. But that obvious advice isn’t so simple to put into practice.
One way traders have tried to make friends with the trend is with a moving average (MA). An MA smooths the price trend by averaging the closing prices over a specified time frame.
The 200-Day Moving Average
The chart below shows the S&P 500 with the 200-day moving average. When the price is above the MA, the Index is in an uptrend. Downtrends are defined as times when the price is below its MA.
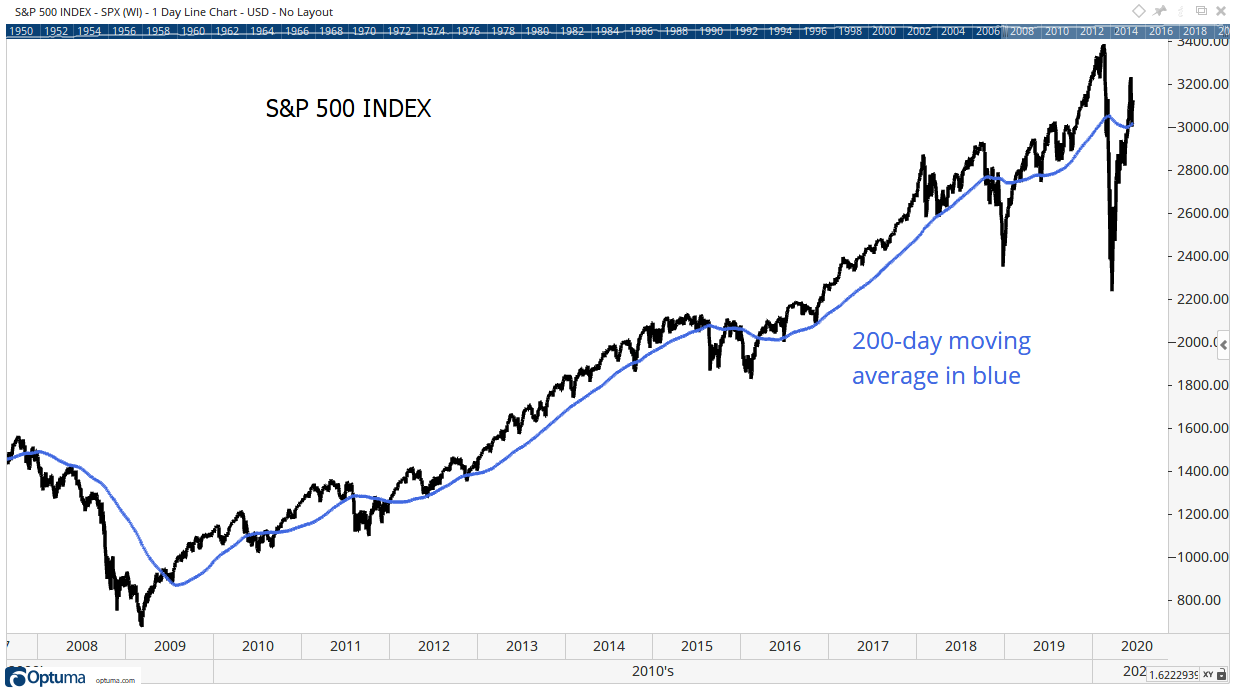
Source: Optuma
The 200-day MA has been extensively studied. Among the students of this technique is Dr. Jeremy Siegel, an economist at the Wharton School of the University of Pennsylvania.
In Stocks for the Long Run, Siegel tested the 200-day moving average using data from 1886 through 2012. He found the strategy allowed investors to get out ahead of major bear markets.
But there are problems with this technique. It gets in long after the bottom of the bear market is established. And it suffers a large number of short-term losing trends in trendless markets. Both of those problems can be seen in the chart above.
Overall, Siegel notes “the 200-day moving average strategy has, over time, allowed you to get out of major bear markets. There are other times, though, when you are whipsawed back and forth going in and out of the market, and this is very costly.
This is particularly true in markets with no trend. Over the long run, you don’t get as high of a return as buy-and-hold investors get, but you do get a reduction in volatility and do miss many bear markets, which many investors regard important enough to sacrifice some return for.”
In other words, the 200-day MA is useful, but it won’t beat the market in the long run.
Right now, the trend according to the 200-day MA is up. The trend is your friend — for now. Getting out when the S&P 500 moves below its 200-day MA could help you avoid the worst of the losses from a bear market.
However, in the long run, this strategy underperforms the broad market because the losses are so large while waiting for a sell signal, and the opportunity costs are large while waiting for a buy signal. Still, the 200-day MA is better than nothing.
Cycle 9 Alert: A More Focused Tool to Spot Trends
While the 200-day MA is useful, there are much better tools to determine the direction of the trend. More focused trend tools are used by my friend and colleague, Money & Markets Chief Investment Strategist Adam O’Dell. To learn more about his work, including details of a simple options trading service that has averaged 39% returns per trade across 200 trades, check out Cycle 9 Alert.
• Michael Carr is a Chartered Market Technician for Banyan Hill Publishing and the Editor of One Trade, Peak Velocity Trader and Precision Profits. He teaches technical analysis and quantitative technical analysis at New York Institute of Finance. Mr. Carr also is the former editor of the CMT Association newsletter Technically Speaking.
Follow him on Twitter @MichaelCarrGuru.