Recent stock market action seems to have been volatile. Many investors think of volatility as an abstract idea, but it can be pictured.
In quantitative terms, volatility can be visualized with a zigzag indicator.
This indicator filters prices moves, requiring a minimum move to reverse. An example is shown in the chart below.
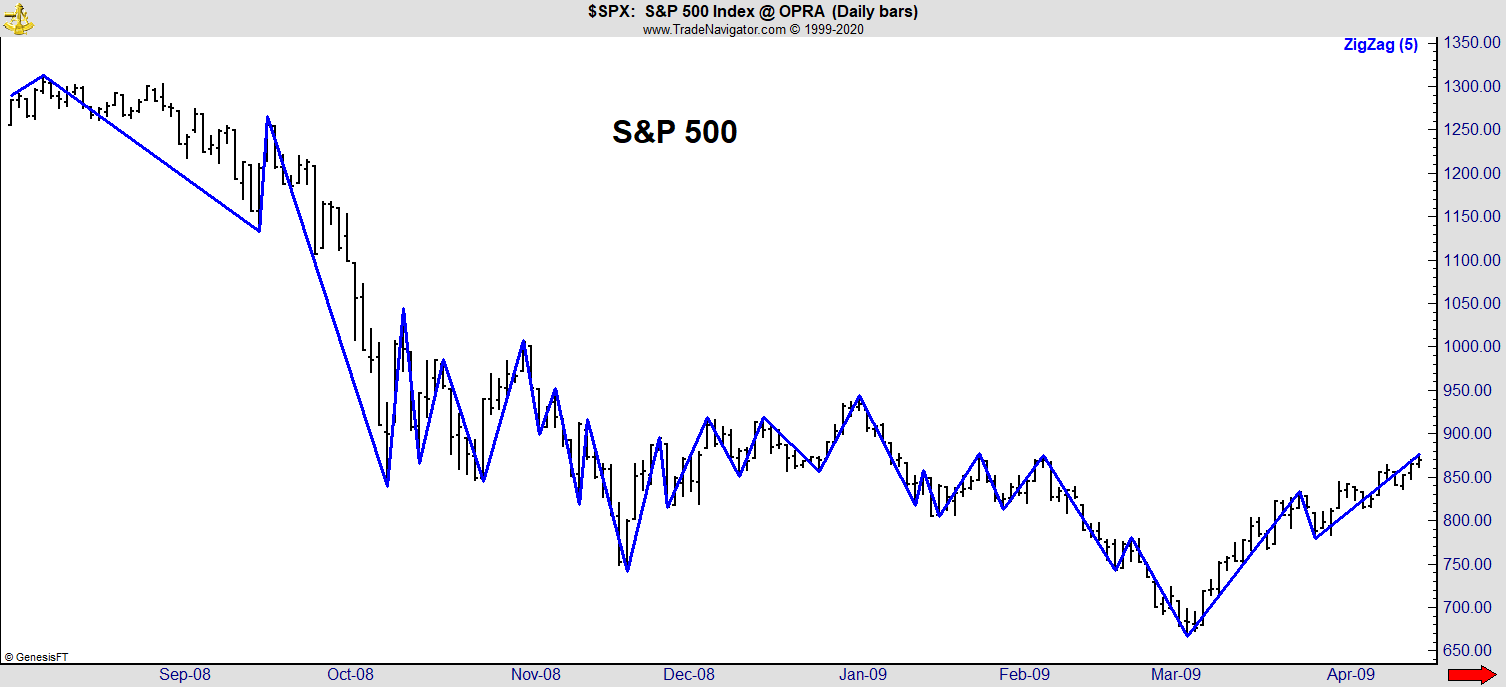
This is a chart of the S&P 500 Index at the bottom of the bear market in 2009. The blue line in this chart changes direction every time price reverses by at least 5%. As prices moved down from October 2008 to March 2009, there were 14 different 5% reversals.
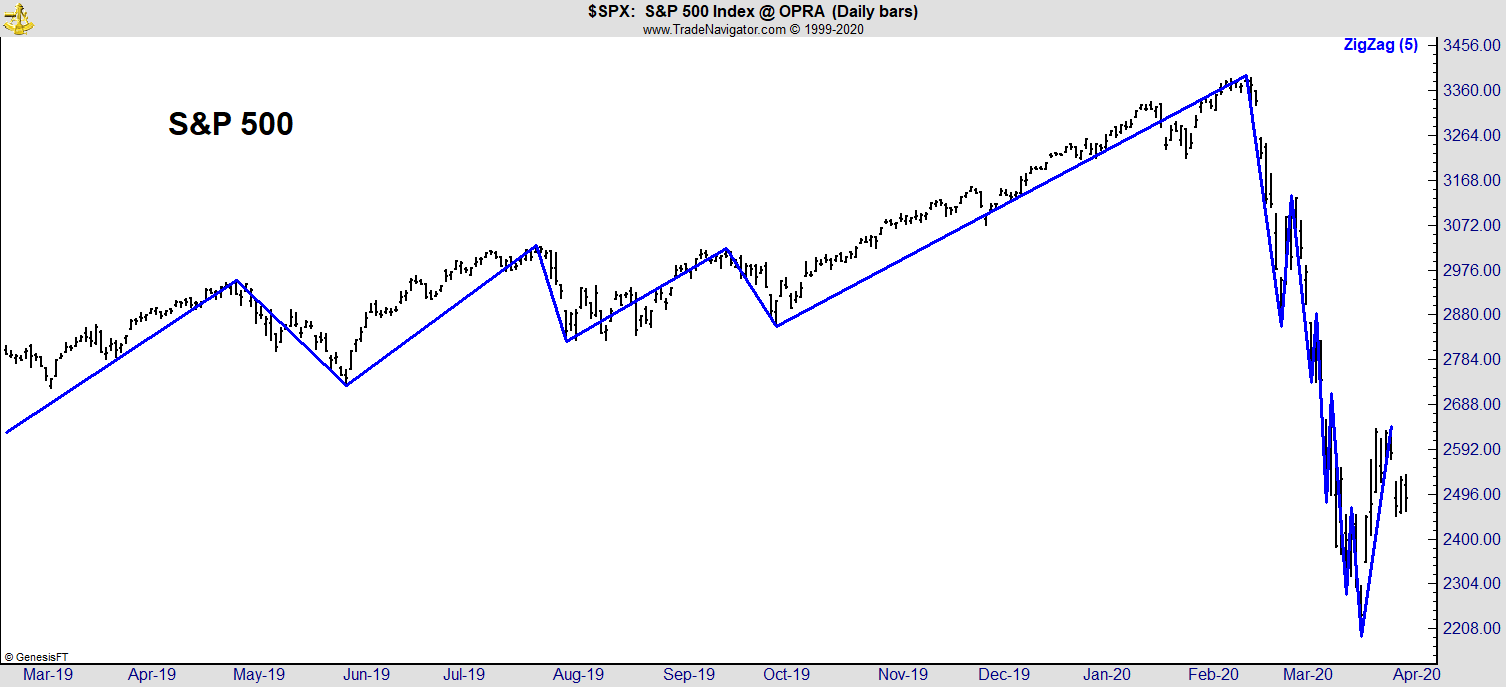
Over the past year, there were just a few 5% reversals until the bear market peaked in February. Then, traders’ excitement can be seen in four 5% reversals in less than a month.
Zigzags are among the simplest and most useful market indicators. They show emotions.
Unemotional traders simply push prices in one direction. Complacency develops and traders become accustomed to steady price changes. In uptrends, they tend to “average up,” adding more money to their investments because they are certain they discovered the key to financial security.
When the trend lasts for years, complacent investors begin to buy dips. More gains follow when the uptrend resumes, reinforcing their belief that prices only move in one direction.
Eventually, the trend reverses and feelings of fear replace complacency. In markets, fear shows up in the chart as volatility, which makes reversals in zigzags more common.
That’s the pattern we saw in late 2008 and again in the last few months. Fear is high now but will give way to complacency soon. That will set up the second down leg of this bear market.
In a typical bear market, there are at least two distinct down legs. We saw the first down leg. Now, we are seeing investors buying the dip.
When the next decline begins, fear will increase sharply, and the number of zigzags will increase. There are likely to be at least a dozen more zigzags before this bear market ends.
After we see at least a dozen zigzags, investors can breathe easy, but that is weeks if not months from now.
• Michael Carr is a Chartered Market Technician for Banyan Hill Publishing and the editor of Peak Velocity Trader and Precision Profits. He teaches technical analysis and quantitative technical analysis at New York Institute of Finance. Michael also is the former editor of the CMT Association newsletter Technically Speaking.
Follow him on Twitter @MichaelCarrGuru